The ongoing pandemic of coronavirus disease 2019, a novel infectious disease caused by severe acute respiratory syndrome was spread in the Philippines on January 30, 2020. Thousands of people in the country tested positive in this virus and some of them recovered from the disease. The following table shows the number of recoveries from April 24 to May 3, 2020 Illustrate the probability distribution if x is the random variable that represents the number of recoveries.
The ongoing pandemic of coronavirus disease 2019, a novel infectious disease caused by severe acute respiratory syndrome was spread in the Philippines on January 30, 2020. Thousands of people in the country tested positive in this virus and some of them recovered from the disease. The following table shows the number of recoveries from April 24 to May 3, 2020 Illustrate the probability distribution if x is the random variable that represents the number of recoveries.

Chapter8: Sequences, Series,and Probability
Section8.7: Probability
Problem 9ECP: A random number generator selects two integers from 1 to 30. What is the probability that both...

Related questions

Concept explainers
Contingency Table
A contingency table can be defined as the visual representation of the relationship between two or more categorical variables that can be evaluated and registered. It is a categorical version of the scatterplot, which is used to investigate the linear relationship between two variables. A contingency table is indeed a type of frequency distribution table that displays two variables at the same time.
Binomial Distribution
Binomial is an algebraic expression of the sum or the difference of two terms. Before knowing about binomial distribution, we must know about the binomial theorem.
Topic Video
Question
The ongoing pandemic of coronavirus disease 2019, a novel infectious disease caused by severe acute respiratory syndrome was spread in the Philippines on January 30, 2020. Thousands of people in the country tested positive in this virus and some of them recovered from the disease. The following table shows the number of recoveries from April 24 to May 3, 2020
Illustrate the probability distribution if x is the random variable that represents the number of recoveries.
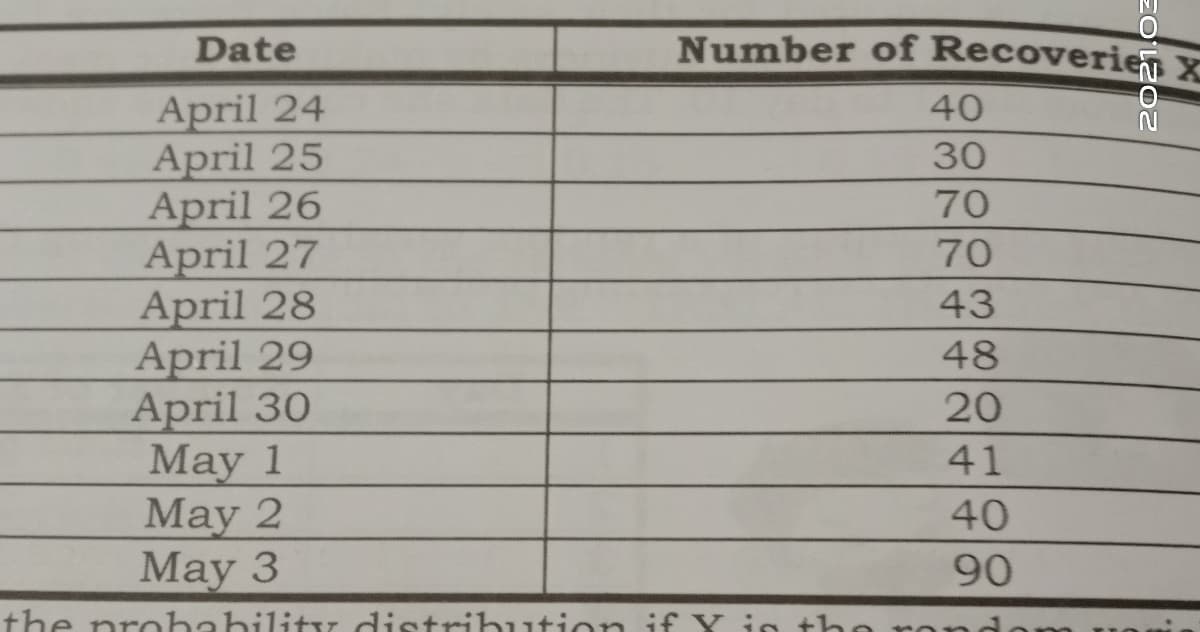
Transcribed Image Text:Date
Number of Recoverien x
April 24
April 25
April 26
April 27
April 28
April 29
April 30
May 1
May 2
May 3
40
30
70
70
43
48
20
41
40
90
the probability distgibution if X is the rer
Expert Solution
This question has been solved!
Explore an expertly crafted, step-by-step solution for a thorough understanding of key concepts.

This is a popular solution!

Trending now
This is a popular solution!

Step by step
Solved in 2 steps with 1 images

Knowledge Booster


Learn more about
Need a deep-dive on the concept behind this application? Look no further. Learn more about this topic, probability and related others by exploring similar questions and additional content below.Recommended textbooks for you

Algebra & Trigonometry with Analytic Geometry
Algebra
ISBN:
9781133382119
Author:
Swokowski
Publisher:
Cengage

Algebra and Trigonometry (MindTap Course List)
Algebra
ISBN:
9781305071742
Author:
James Stewart, Lothar Redlin, Saleem Watson
Publisher:
Cengage Learning
Algebra & Trigonometry with Analytic Geometry
Algebra
ISBN:
9781133382119
Author:
Swokowski
Publisher:
Cengage
Algebra and Trigonometry (MindTap Course List)
Algebra
ISBN:
9781305071742
Author:
James Stewart, Lothar Redlin, Saleem Watson
Publisher:
Cengage Learning

College Algebra
Algebra
ISBN:
9781305115545
Author:
James Stewart, Lothar Redlin, Saleem Watson
Publisher:
Cengage Learning

College Algebra (MindTap Course List)
Algebra
ISBN:
9781305652231
Author:
R. David Gustafson, Jeff Hughes
Publisher:
Cengage Learning