The output below was generated from the analysis of a balanced 2x3 factorial experiment (Ais qualitative and 13 eis quantitative) using the model Yau+A B (AB+ Source DF Sum of LSMEAN 66.00 73.33 Squares Mean Square F Value PrF Madet 5 0.5 0.10 3273.17 Error 654.63 20.61 <0001 12 265 33 Corrected Total 22.11 87.33 17 3538 50 020 99.67 0.15 99.33 Source DFType ii ss Mein Square FValue P 99.33 1020 2568.06 116.14 <0001 7.76 0.0069 8.19 0.0057 2568.06 343.00 171.50 AB 362.11 181.06 a N= b. What hypothesis is tested by the computed F-value 29.617 C. vwhat proportion of the total variability in the Y's is explained by the model with both main effects and interaction? mndel (the model that does not include
The output below was generated from the analysis of a balanced 2x3 factorial experiment (Ais qualitative and 13 eis quantitative) using the model Yau+A B (AB+ Source DF Sum of LSMEAN 66.00 73.33 Squares Mean Square F Value PrF Madet 5 0.5 0.10 3273.17 Error 654.63 20.61 <0001 12 265 33 Corrected Total 22.11 87.33 17 3538 50 020 99.67 0.15 99.33 Source DFType ii ss Mein Square FValue P 99.33 1020 2568.06 116.14 <0001 7.76 0.0069 8.19 0.0057 2568.06 343.00 171.50 AB 362.11 181.06 a N= b. What hypothesis is tested by the computed F-value 29.617 C. vwhat proportion of the total variability in the Y's is explained by the model with both main effects and interaction? mndel (the model that does not include

Big Ideas Math A Bridge To Success Algebra 1: Student Edition 2015
1st Edition
ISBN:9781680331141
Author:HOUGHTON MIFFLIN HARCOURT
Publisher:HOUGHTON MIFFLIN HARCOURT
Chapter3: Graphing Linear Functions
Section3.1: Functions
Problem 48E

Related questions
Question
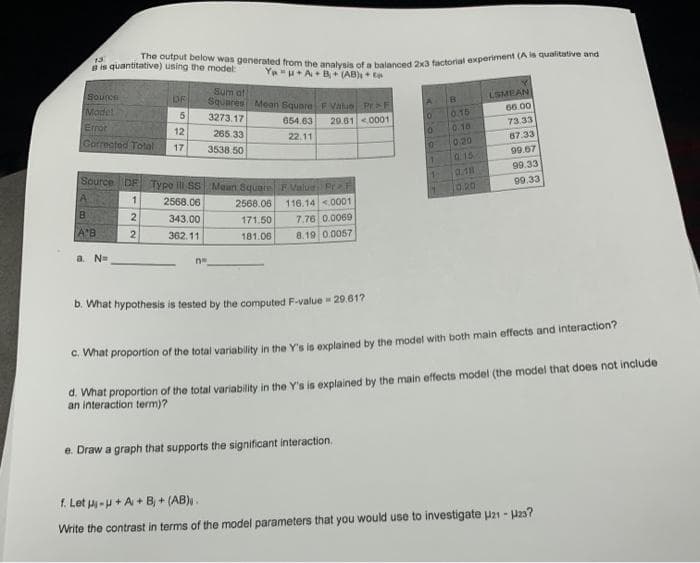
Transcribed Image Text:The output below was generated from the analysis of a balanced 2x3 factorial experiment (A is qualitative and
13
8 is quantitative) using the modet
Ya"u+A+ B+ (AB)+
Sum ot
Squares Moan Square F Vatun Pr>F
Sounce
DE
LSMEAN
Madel
Error
Corrected Total
3273.17
0.15
66.00
654.63
20.61 <0001
12
265 33
0.10
73.33
22.11
17
87.33
3538.50
020
99.67
0.15
Source DF Type ili ss Meun Square F Value Pr
99.33
0.11
99.33
1.
(020
2568.06
116.14 <0001
7.76 0.0069
8.19 0.0057
2568.06
343.00
171.50
A*B
362.11
181.06
a. N=
b. What hypothesis is tested by the computed F-value 29.61?
e. What proportion of the total variability in the Y's is explained by the model with both main effects and interaction?
d. What proportion of the total variability in the Y's is explained by the main effects model (the model that does not include
an interaction term)?
e. Draw a graph that supports the significant interaction.
1. Let u -H + A + B + (AB),.
Write the contrast in terms of the model parameters that you would use to investigate u21 -
Expert Solution
This question has been solved!
Explore an expertly crafted, step-by-step solution for a thorough understanding of key concepts.

Step by step
Solved in 4 steps with 1 images

Recommended textbooks for you
Big Ideas Math A Bridge To Success Algebra 1: Stu…
Algebra
ISBN:
9781680331141
Author:
HOUGHTON MIFFLIN HARCOURT
Publisher:
Houghton Mifflin Harcourt

Big Ideas Math A Bridge To Success Algebra 1: Stu…
Algebra
ISBN:
9781680331141
Author:
HOUGHTON MIFFLIN HARCOURT
Publisher:
Houghton Mifflin Harcourt