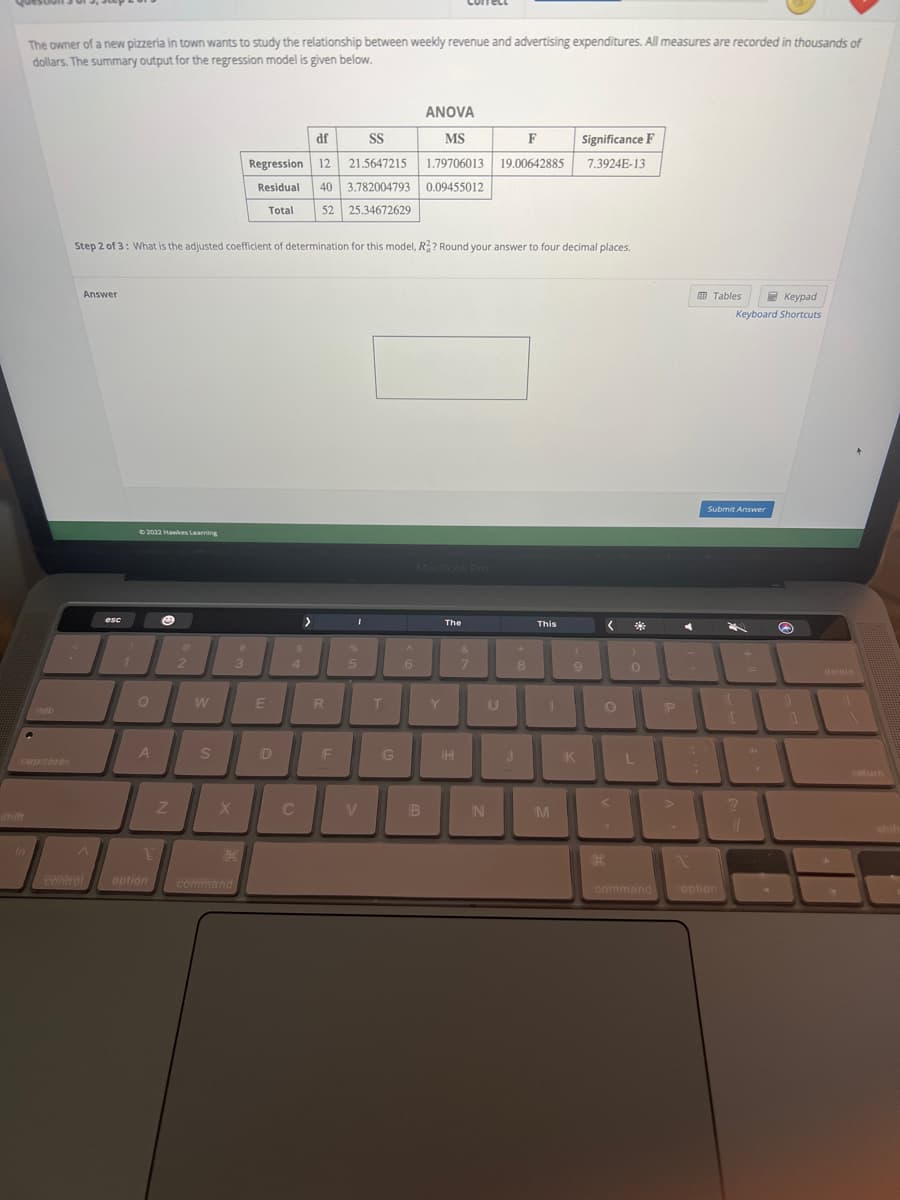
The owner of a new pizzeria in town wants to study the relationship between weekly revenue and advertising expenditures. All measures are recorded in thousands of dollars. The summary output for the regression model is given below. ANOVA MS 1.79706013 19.00642885 F Answer df SS Regression 12 21.5647215 Residual 40 3.782004793 0.09455012 Total 52 25.34672629 Significance F 7.3924E-13 Step 2 of 3: What is the adjusted coefficient of determination for this model, R?? Round your answer to four decimal places. Keypad Keyboard Shortcuts Tables Submit Answer
Q: Suppose Z follows the standard normal distribution. Use the calculator provided, or this table, to…
A: Answer: - Given, a standard normal distribution Z ~ N( μ , σ ) Where mean μ = 0…
Q: Give a contingency table showing structural and random zeros.
A:
Q: How large a sample must you take to be 90% confident that the estimate is within 0.05 of the true…
A: It is given that p = 23% = 0.23 Margin of error, E = 0.05 Confidence level = 90%
Q: An article gave the following observations on maximum concrete pressure (kN/m²). 33.3 41.9 37.4 40.3…
A: The data shows the maximum concrete pressure.
Q: Detailed experimental design should include the type of experiment, how you chose your sample size,…
A: Given:: Detailed experimental design should include the type of experiment, how you chose your…
Q: You are conducting a study to see if the proportion of women over 40 who regularly have mammograms…
A: Given,Test statistic(Z)=1.464H0:P=0.83H1:P>0.83
Q: An independent consumer group published its finding that the lifetimes of electric bulbs…
A: We have given that Mean(µ) = 690Standard deviations (σ) = 125 σ
Q: A health scientist is testing the effectiveness of three different diets (Diet A, Diet B, and Diet…
A: Here the researcher wants to test if the means of the three groups are equal or not.
Q: For a certain type of salamander, the mass (X) of a randomly chosen adult is normally distributed.…
A: The mass X of a randomly chosen adult is normally distributed. A 95% confidence interval for the…
Q: You are conducting a study to see if the proportion of women over 40 who regularly have mammograms…
A: Given,Test statistic(Z)=2.81H0:P=0.59H1:P>0.59
Q: 2. Mohammed is building a fence with two rails and one post in each section. Fill in the missing…
A: One section has Post 1 Rail 2 Number of Sections Number of posts Number of rails 0 1…
Q: TESTING HYPOTHESES FOR DIFFERENCES BETWEEN TWO MEANS OR PROPORTIONS 5.44 A consulting firm wants to…
A: In testing of hypothesis, there are two hypotheses - null and alternative. Based on the given sample…
Q: what is the variable of interest in the question? How many levels does it have and what are they?
A: No of Voters = 75 COVID-19 pandemic, a local precinct has conducted elections and the type of…
Q: The admissions officer for Clearwater College developed the following estimated regression equation…
A: ANOVA: F = MSReg/MSres = 0.8810/0.0168 =52.4405 p-value at F= 52.4405 and 2,7 df is 0.000061
Q: For a confidence level of 92%, find the critical value Z OF Question Help: Video
A: Solution: Given information: Confidence level= C= 0.92=92% Significance level =α=1-C=0.08
Q: Any basketball fan knows that Shaquille O’Neal, one of the NBA’s most dominant centers of the last…
A: Solution: Given information: n=39 Sample size x=26 successes p= 0.533 Population proportion.
Q: 2. It is thought that a new process for producing a certain chemical may be cheaper than the…
A: 2. The given data is New Process Old Process 55 60 62 61 64 66 66 65 68 59 61 64 58…
Q: A toy manufacturer wants to see how long, on average, a new toy captures children's attention. He…
A: given data, n=16X¯=27S=8normal distribution, CI=0.90α=1-0.90=0.10
Q: If a product is selected at random, what is the probability that (a) This product is a hardware…
A: It is given that For Company A: Software products = 40 Hardware products = 30 Total products = 70…
Q: UESTION 5 We are interested in testing whether the variance of a population is significantly less…
A: Given (5) Standard deviations σ=1.44 Note: According to Bartleby guidelines expert solve only one…
Q: A student researcher was surprised to learn that the 2017 NCAA Student-Athlete Substance Use Survey…
A: Given:-
Q: Deduction of the binomial distribution.
A: We have find Deduction of the binomial distribution
Q: A study of life expectancy showed that a random sample of 6 states had a standard deviation of 0.8…
A: Given .n=6, s=0.8, level of significance ɑ=0.05
Q: Claudia’s bakery business has taken off. Her goods are so popular that she has decided to invest in…
A: The test is to check whether the new machine produces dough with a variance in the amounts of yeast…
Q: A health scientist is testing the effectiveness of three different diets (Diet A, Diet B, and Diet…
A:
Q: The estimated regression equation for a model involving two independent variables and 10…
A: Solution: The estimated multiple regression equation is y^ =29.1570+0.5509x1+0.4940x2
Q: order to ensure that there is not a large disparity in the quality of education at various schools…
A: Given Alpha=0.05 n=27 Mean=189.720 Standard deviation=2.230
Q: Use Excel’s Data Analysis tool to conduct a multiple regression, using Salary as the dependent…
A: Given data: Salary Gender Years Of Service Years Of Education 52,100 0 5 13 55,015 0 20 13…
Q: 39. Perturbing a Poisson process. Let II be the set of points in a Poisson process on Rd with…
A:
Q: (a) What property of the values in the table above mean that X is not uniformly distributed? (b)…
A: It is given that the random variable X represent the leading digit of a naturally occurring number.
Q: It is analogous to consider the sample mean as the center of the balance point of our data O True…
A: It is analogous to consider the sample mean as the center of the balance point of our data.
Q: -k The monthly incomes for 12 randomly selected people, each with a bachelor's 4450.86 degree in…
A: According to the given information in this question We need to find mean , standard deviation and 99…
Q: A popular theory is that presidential candidates have an advantage if they are taller than their…
A: The given data shows the heights of presidents and their main opponents.
Q: I am conducting a study per an assignment that uses a survey with 6 categories of questions in…
A: The question demands the procedure of finding the overall mean for the data collected in a Likert…
Q: QUESTION 15 The number of degrees of freedom associated with the chi-square distribution in a test…
A: Let n be the number of rows and m be the column of the table
Q: 3. Let X₁ and X₂ be a pair of random variables. Show that the covariance between the random…
A:
Q: (d) Compute the linear correlation coefficient between MRI count and IQ for females. Compute the…
A: From given data we have Female : Male :
Q: Which of the following decisions do we arrive at if the p-value < a level of significance O Reject…
A: Hello! As you have posted 2 different questions, we are answering the first question. In case you…
Q: K Dok A researcher wishes to estimate, with 95% confidence, the population proportion of families…
A: Given that Margin of error =E =5%=0.05 95% confidence.
Q: Sarah is the office manager for a group of financial advisors who provide financial services for…
A: The test-statistic to test the population coefficient of determination is given by, F* = (R2/k) /…
Q: (c) What is your best estimate of the percent change in urinary protein based on the data in the…
A: Consider X1 and X2 be the two random variables representing the measurements (in scale) after and…
Q: Question 3. Customers sometimes have to wait a long time to speak to a customer service…
A: From the provided information, Sample size (n) = 25 Sample mean (x̄) = 22 Sample standard deviation…
Q: a. Test the claim using a hypothesis test. Consider the first sample to be the sample of people over…
A: Given Alpha=0.05 N1=295 N2=312
Q: Claudia’s bakery business has taken off. Her goods are so popular that she has decided to invest in…
A: Given Alpha=0.05 Variance=0.18 Standard deviation=0.32
Q: Hypertension It has been found that 26% of men 20 years and older suffer from hypertension (high…
A: From the provided information, x1=45n1=133x2=59n2=133α=0.10
Q: ow many hours per week do gamers play video games? A simple random sample of 60 U.S. gamers age 13…
A: The question is about confidence interval Given : To find : a ) 97 % CI b ) conditions
Q: Assume the random variable x is normally distributed with mean = 50 and standard deviation o=7. Find…
A: Given that,μ=50,σ=7
Q: 2500, 2410, 2199, 2139, 2291, 2301, 2211, 2565, 2036 Send data to calculator used on this sample,…
A: Data given 2500, 2410, 2199, 2139, 2291, 2301, 2211, 2565, 2036
Q: QUESTION 13 The sampling distribution for a goodness of fit test is the a. Poisson b. t c. normal d.…
A:
Q: An SRS of 25 recent birth records at the local hospital was selected. In the sample, the average…
A: given data normal distribution n = 25σ = 6.5x¯ = 119.6describe sampling distribution.
Trending now
This is a popular solution!
Step by step
Solved in 2 steps with 2 images
- If your graphing calculator is capable of computing a least-squares sinusoidal regression model, use it to find a second model for the data. Graph this new equation along with your first model. How do they compare?A researcher is hired to investigate the relationship between the number of unauthorized days that employees are absent per year and the distance in miles between home and work for the employees. A sample of 10 employees was chosen and the results are listed in the chart below. Use the proper Data Analysis function in Excel to computethe regression equation needed to predict the number of missed days that could be expected foremployees who live certain distances away from the workplace. Distance to Work (miles): 1, 3, 4, 6, 9, 10, 12, 14, 14, 18 Number of Days Absent: 9, 6, 7, 7, 6, 4, 5, 3, 4, 2A researcher examined the relationship between the annual tax amount paid by the construction company owners and the total expense items spent for the construction with regression analysis and calculated the regression line estimation as Y=6+2X. According to this; Write the interpretations of the cutoff and regression parameters, respectively, in your OWN SENTENCES in a statistically appropriate way over the tax amount and expenses.
- A study in the univeristy of massachusetts amherst published in the may 2007 journal of marriage and family found that married women do about one fewer hour of housework a week for every $7500 they earn as a full time workers outside of the home, regardless of their husband's income A) what would be the numerical value of the slope coefficient in the regression model that predicts womens housework hours from their income? what does the sign of the slope (positive or negative) tell us about the relationship between these variables B) Suppose Lynette's salary is $30,000 greater than Gabriells. what would you predict the difference in hours of housework they each do.A local University conducted a survey of over 2,000 MBA alumni to explore the issue of work-life balance. Each participant received a score ranging from 0 to 100, with lower scores indicating a higher imbalance between work and life. A sample of the data is available below. Let x=average number of hours worked per week and y=work-life balance scale score for each MBA alumnus. Investigate the link between these two variables by conducting a complete simple linear regression analysis of the data. Summarize your findings. Hours WLB Score 50 73.22 45 70.79 50 48.78 55 44.15 55 69.89 60 53.15 50 56.04 60 22.53 50 60.73 55 69.89 70 29.17 45 70.79 40 33.38 40 32.13 45 46.17 The least squares regression equation is y=enter your response here+enter your…A local University conducted a survey of over 2,000 MBA alumni to explore the issue of work-life balance. Each participant received a score ranging from 0 to 100, with lower scores indicating a higher imbalance between work and life. A sample of the data is available below. Let x=average number of hours worked per week and y=work-life balance scale score for each MBA alumnus. Investigate the link between these two variables by conducting a complete simple linear regression analysis of the data. Summarize your findings. Hours WLB Score 50 73.22 45 70.79 50 48.78 55 44.15 55 69.89 60 53.15 50 56.04 60 22.53 50 60.73 55 69.89 70 29.17 45 70.79 40 33.38 40 32.13 45 46.17 Check the usefulness of the hypothesized model. What are the hypotheses to test?…
- A local University conducted a survey of over 2,000 MBA alumni to explore the issue of work-life balance. Each participant received a score ranging from 0 to 100, with lower scores indicating a higher imbalance between work and life. A sample of the data is available below. Let x=average number of hours worked per week and y= work-life balance scale score for each MBA alumnus. Investigate the link between these two variables by conducting a complete simple linear regression analysis of the data. Summarize your findings. Hours WLB Score 50 74.09 45 72.45 50 52.93 55 44.33 50 69.15 60 54.79 55 56.26 60 20.44 55 6-.64 50 69.15 70 29.16 45 72.45 40 33.25 40 32.18 45 45.76 a. What is the test statistic for the hypotheses? t=______ b. What is the p-value for the test statistic? p-value=________ c. What is the value for the coeffiecent of determination r^2? r^2=________At a .01 level of significance is there sufficient evidence to conclude that the number of books sold is related to the number of registered students in a straight-line manner, and give the regression equation.A business statistics professor would like to develop a regression model to predict the final exam scores for students based on their current GPAs, the number of hours they studied for the exam, the number of times they were absent during the semester, and their genders. The data for these variables are given in the accompanying table at the bottom of this page. a) Using Excel, construct a regression model using all of the independent variables. Create the dummy variable Gen, which equals 1 for a male and 0 for a female student ( this assignment is arbitrary) complete the regression equation for the model below, where y= Score, x1= GPA, x2= Hours, x3= Absenses, and x4= Gen. y= (__) + (__)x1 + (__)x2 + (__)x3 + (__)x4 b) Test the significance of the overall regression model using a= 0.10. c) interpret the meaning of the regression coefficient for the dummy variable. d) using the p-values, identify which independent variables are significant with a= 0.10. e) construct a regression…
- An automotive sales manager wishes to examine the relationship between age (years) and sales price ($) for used automobiles of a certain brand. The accompanying table contains data for a sample of a certain make and model that were listed for sale at a car shopping website. b. Fit a quadratic regression model to predict price and state the quadratic regression equation.Why do we have in general, two lines of regression? Obtain the regression of Y on X and X on Y from the following table and estimate the blood pressure when the age is 45. Also give the interpretation.A prospective MBA student wanted to predict starting salary upon graduation, based on program per-year tuition (stored in FTMBA). Using the results of that problem, a. determine the coefficient of determination, r², and interpret its meaning. b. determine the standard error of the estimate. c. How useful do you think this regression model is for predicting starting salary?