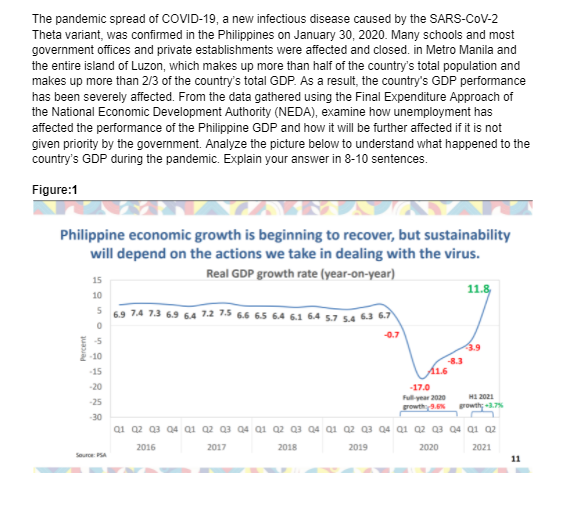
The pandemic spread of COVID-19, a new infectious disease caused by the SARS-CoV-2 Theta variant, was confirmed in the Philippines on January 30, 2020. Many schools and most government offices and private establishments were affected and closed. in Metro Manila and the entire island of Luzon, which makes up more than half of the country's total population and makes up more than 2/3 of the country's total GDP. As a result, the country's GDP performance has been severely affected. From the data gathered using the Final Expenditure Approach of the National Economic Development Authority (NEDA), examine how unemployment has affected the performance of the Philippine GDP and how it will be further affected if it is not given priority by the government. Analyze the picture below to understand what happened to the country's GDP during the pandemic. Explain your answer in 8-10 sentences. Figure:1 Philippine economic growth is beginning to recover, but sustainability will depend on the actions we take in dealing with the virus. Real GDP growth rate (year-on-year) 15 11.8 10 5 69 74 73 69 64 7.2 7.5 66 65 64 61 664 57 54 63 6.7 10 15 20 -17.0 Puyear 2020 H 2021 25 wth 30 ai a2 a3 04 a1 az a3 04 a1 a2 a3 a4 a1 a2 a3 04 a1 a2 a3 04 a1 a2 2016 2017 2018 2019 2020 2021 Seure A 11 Percent
The pandemic spread of COVID-19, a new infectious disease caused by the SARS-CoV-2 Theta variant, was confirmed in the Philippines on January 30, 2020. Many schools and most government offices and private establishments were affected and closed. in Metro Manila and the entire island of Luzon, which makes up more than half of the country's total population and makes up more than 2/3 of the country's total GDP. As a result, the country's GDP performance has been severely affected. From the data gathered using the Final Expenditure Approach of the National Economic Development Authority (NEDA), examine how unemployment has affected the performance of the Philippine GDP and how it will be further affected if it is not given priority by the government. Analyze the picture below to understand what happened to the country's GDP during the pandemic. Explain your answer in 8-10 sentences. Figure:1 Philippine economic growth is beginning to recover, but sustainability will depend on the actions we take in dealing with the virus. Real GDP growth rate (year-on-year) 15 11.8 10 5 69 74 73 69 64 7.2 7.5 66 65 64 61 664 57 54 63 6.7 10 15 20 -17.0 Puyear 2020 H 2021 25 wth 30 ai a2 a3 04 a1 az a3 04 a1 a2 a3 a4 a1 a2 a3 04 a1 a2 a3 04 a1 a2 2016 2017 2018 2019 2020 2021 Seure A 11 Percent

Chapter1: Introducing The Economic Way Of Thinking
Section: Chapter Questions
Problem 10SQ

Related questions
Question
Transcribed Image Text:The pandemic spread of COVID-19, a new infectious disease caused by the SARS-CoV-2
Theta variant, was confirmed in the Philippines on January 30, 2020. Many schools and most
government offices and private establishments were affected and closed. in Metro Manila and
the entire island of Luzon, which makes up more than half of the country's total population and
makes up more than 2/3 of the country's total GDP. As a result, the country's GDP performance
has been severely affected. From the data gathered using the Final Expenditure Approach of
the National Economic Development Authority (NEDA), examine how unemployment has
affected the performance of the Philippine GDP and how it will be further affected if it is not
given priority by the government. Analyze the picture below to understand what happened to the
country's GDP during the pandemic. Explain your answer in 8-10 sentences.
Figure:1
Philippine economic growth is beginning to recover, but sustainability
will depend on the actions we take in dealing with the virus.
Real GDP growth rate (year-on-year)
15
11.8
10
5 69 74 73 69 64 7.2 7.5 6,6 65 64 61 6.4 5.7 5.4 63 6.7
0.7
-5
-10
8.3
-15
A16
-20
-17.0
ar 2020
HI 2021
-25
Fowth 3N
Powth 7%
30
a1 a2 a3 04 a1 az 03 04 Q1 a2 03 Q4 Q1 a2 Q3 04 Q1 a2 a3 04 Q1 a2
2016
2017
2018
2019
2020
2021
Source PSA
11
Percent
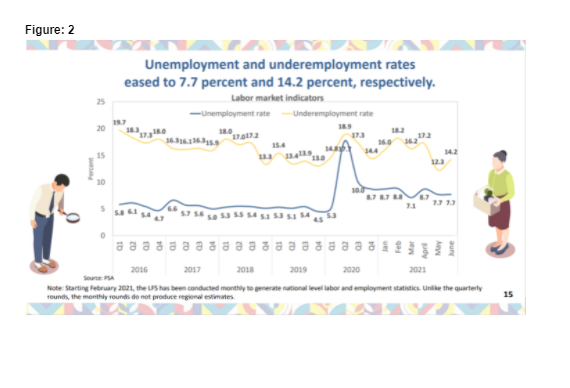
Transcribed Image Text:Figure: 2
Unemployment and underemployment rates
eased to 7.7 percent and 14.2 percent, respectively.
Labor market indicators
-Unemployment rate
Underemployment rate
173
36.316.1 36.315.9
15.4
14.2
15
12.3
87 87
7.7 13
sa sa sS S4 sa S3 sa 54
2016
2017
2018
2019
2020
2021
Soure: PSA
Note: Starting February 2021, the PS has been conducted monthly to generate national level labor and employment statistics. Unlike the quarterly
rounds, the monthly rounds do not produce regional estimates
15
Percent
Expert Solution
This question has been solved!
Explore an expertly crafted, step-by-step solution for a thorough understanding of key concepts.

Step by step
Solved in 2 steps

Knowledge Booster


Learn more about
Need a deep-dive on the concept behind this application? Look no further. Learn more about this topic, economics and related others by exploring similar questions and additional content below.Recommended textbooks for you


