The percentage of female high school graduates who enrolled in college is given in the table below.
The percentage of female high school graduates who enrolled in college is given in the table below.

Functions and Change: A Modeling Approach to College Algebra (MindTap Course List)
6th Edition
ISBN:9781337111348
Author:Bruce Crauder, Benny Evans, Alan Noell
Publisher:Bruce Crauder, Benny Evans, Alan Noell
Chapter5: A Survey Of Other Common Functions
Section5.6: Higher-degree Polynomials And Rational Functions
Problem 1TU: The following fictitious table shows kryptonite price, in dollar per gram, t years after 2006. t=...

Related questions
Question
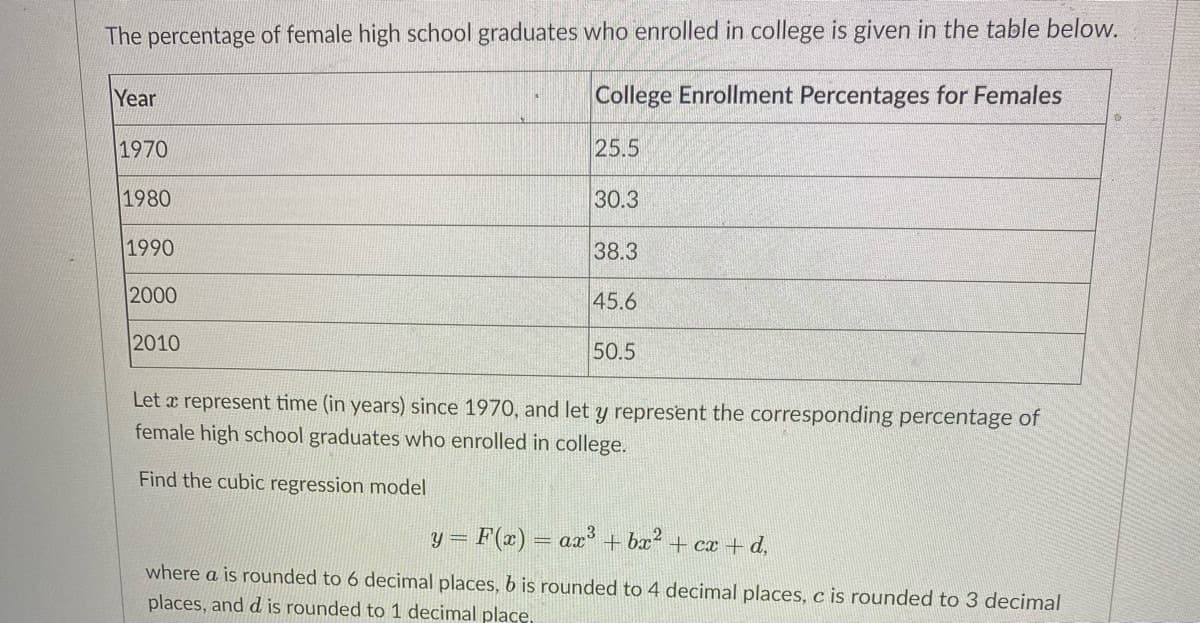
Transcribed Image Text:The percentage of female high school graduates who enrolled in college is given in the table below.
Year
College Enrollment Percentages for Females
1970
25.5
1980
30.3
1990
38.3
2000
45.6
2010
50.5
Let x represent time (in years) since 1970, and let y represent the corresponding percentage of
female high school graduates who enrolled in college.
Find the cubic regression model
y =
= F(x) = ax' + bæ?
+ cx + d,
where a is rounded to 6 decimal places, b is rounded to 4 decimal places, c is rounded to 3 decimal
places, and d is rounded to 1 decimal place,
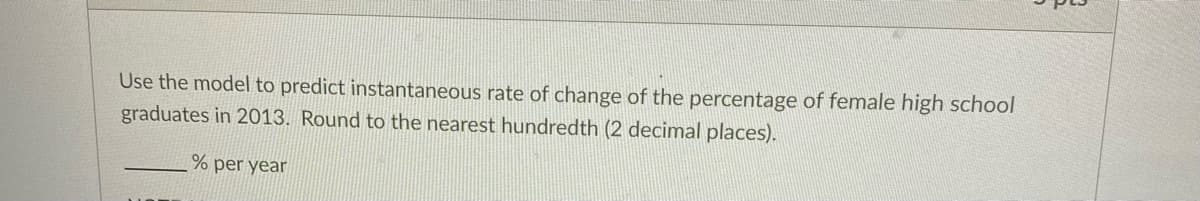
Transcribed Image Text:Use the model to predict instantaneous rate of change of the percentage of female high school
graduates in 2013. Round to the nearest hundredth (2 decimal places).
% per year
Expert Solution
This question has been solved!
Explore an expertly crafted, step-by-step solution for a thorough understanding of key concepts.

This is a popular solution!

Trending now
This is a popular solution!

Step by step
Solved in 3 steps with 1 images

Recommended textbooks for you
Functions and Change: A Modeling Approach to Coll…
Algebra
ISBN:
9781337111348
Author:
Bruce Crauder, Benny Evans, Alan Noell
Publisher:
Cengage Learning

College Algebra
Algebra
ISBN:
9781305115545
Author:
James Stewart, Lothar Redlin, Saleem Watson
Publisher:
Cengage Learning

Linear Algebra: A Modern Introduction
Algebra
ISBN:
9781285463247
Author:
David Poole
Publisher:
Cengage Learning
Functions and Change: A Modeling Approach to Coll…
Algebra
ISBN:
9781337111348
Author:
Bruce Crauder, Benny Evans, Alan Noell
Publisher:
Cengage Learning
College Algebra
Algebra
ISBN:
9781305115545
Author:
James Stewart, Lothar Redlin, Saleem Watson
Publisher:
Cengage Learning
Linear Algebra: A Modern Introduction
Algebra
ISBN:
9781285463247
Author:
David Poole
Publisher:
Cengage Learning

Algebra & Trigonometry with Analytic Geometry
Algebra
ISBN:
9781133382119
Author:
Swokowski
Publisher:
Cengage