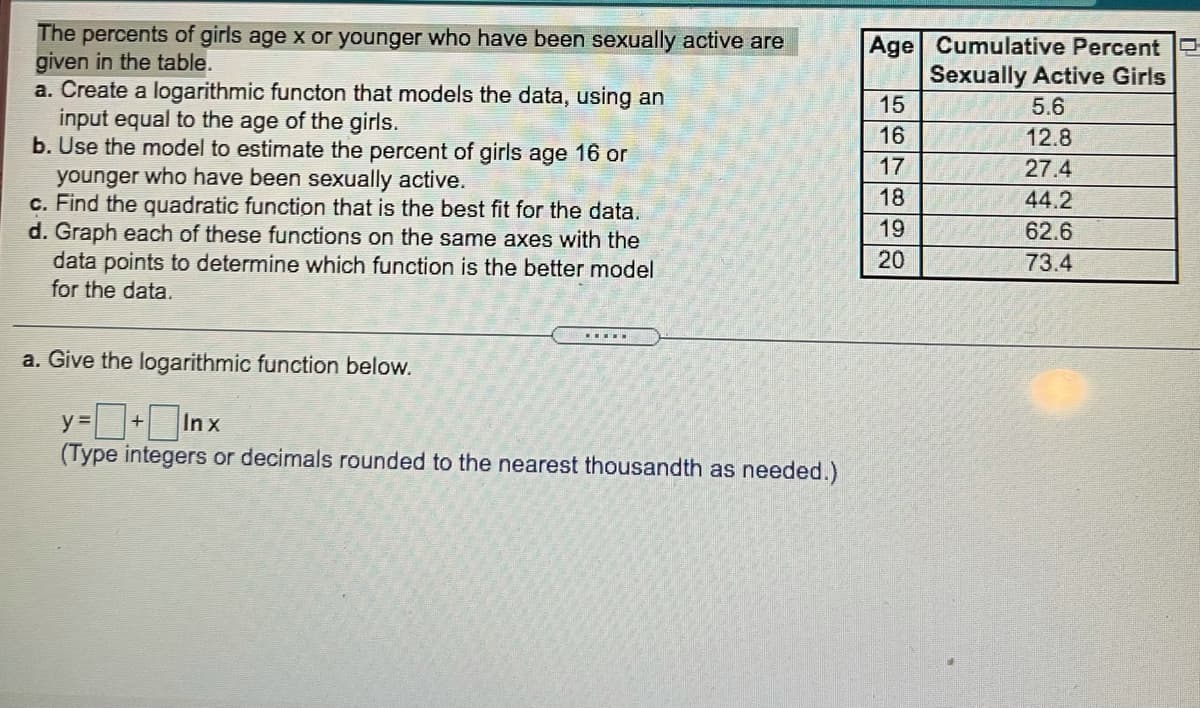
The percents of girls age x or younger who have been sexually active are given in the table. a. Create a logarithmic functon that models the data, using an input equal to the age of the girls. b. Use the model to estimate the percent of girls age 16 or younger who have been sexually active. c. Find the quadratic function that is the best fit for the data. d. Graph each of these functions on the same axes with the data points to determine which function is the better model for the data. Age Cumulative Percent Sexually Active Girls 15 5.6 16 12.8 17 27.4 18 44.2 19 62.6 20 73.4 a. Give the logarithmic function below. y=+Inx (Type integers or decimals rounded to the nearest thousandth as needed.)
The percents of girls age x or younger who have been sexually active are given in the table. a. Create a logarithmic functon that models the data, using an input equal to the age of the girls. b. Use the model to estimate the percent of girls age 16 or younger who have been sexually active. c. Find the quadratic function that is the best fit for the data. d. Graph each of these functions on the same axes with the data points to determine which function is the better model for the data. Age Cumulative Percent Sexually Active Girls 15 5.6 16 12.8 17 27.4 18 44.2 19 62.6 20 73.4 a. Give the logarithmic function below. y=+Inx (Type integers or decimals rounded to the nearest thousandth as needed.)

College Algebra (MindTap Course List)
12th Edition
ISBN:9781305652231
Author:R. David Gustafson, Jeff Hughes
Publisher:R. David Gustafson, Jeff Hughes
Chapter5: Exponential And Logarithmic Functions
Section5.2: Applications Of Exponential Functions
Problem 43E

Related questions
Question
Transcribed Image Text:The percents of girls age x or younger who have been sexually active are
given in the table.
a. Create a logarithmic functon that models the data, using an
input equal to the age of the girls.
b. Use the model to estimate the percent of girls age 16 or
younger who have been sexually active.
c. Find the quadratic function that is the best fit for the data.
d. Graph each of these functions on the same axes with the
data points to determine which function is the better model
for the data.
Age Cumulative Percent
Sexually Active Girls
15
5.6
16
12.8
17
27.4
18
44.2
19
62.6
20
73.4
a. Give the logarithmic function below.
y =+ In x
(Type integers or decimals rounded to the nearest thousandth as needed.)
Expert Solution
This question has been solved!
Explore an expertly crafted, step-by-step solution for a thorough understanding of key concepts.

This is a popular solution!

Trending now
This is a popular solution!

Step by step
Solved in 3 steps with 2 images

Recommended textbooks for you
College Algebra (MindTap Course List)
Algebra
ISBN:
9781305652231
Author:
R. David Gustafson, Jeff Hughes
Publisher:
Cengage Learning


Algebra & Trigonometry with Analytic Geometry
Algebra
ISBN:
9781133382119
Author:
Swokowski
Publisher:
Cengage
College Algebra (MindTap Course List)
Algebra
ISBN:
9781305652231
Author:
R. David Gustafson, Jeff Hughes
Publisher:
Cengage Learning
Algebra & Trigonometry with Analytic Geometry
Algebra
ISBN:
9781133382119
Author:
Swokowski
Publisher:
Cengage

Trigonometry (MindTap Course List)
Trigonometry
ISBN:
9781337278461
Author:
Ron Larson
Publisher:
Cengage Learning
