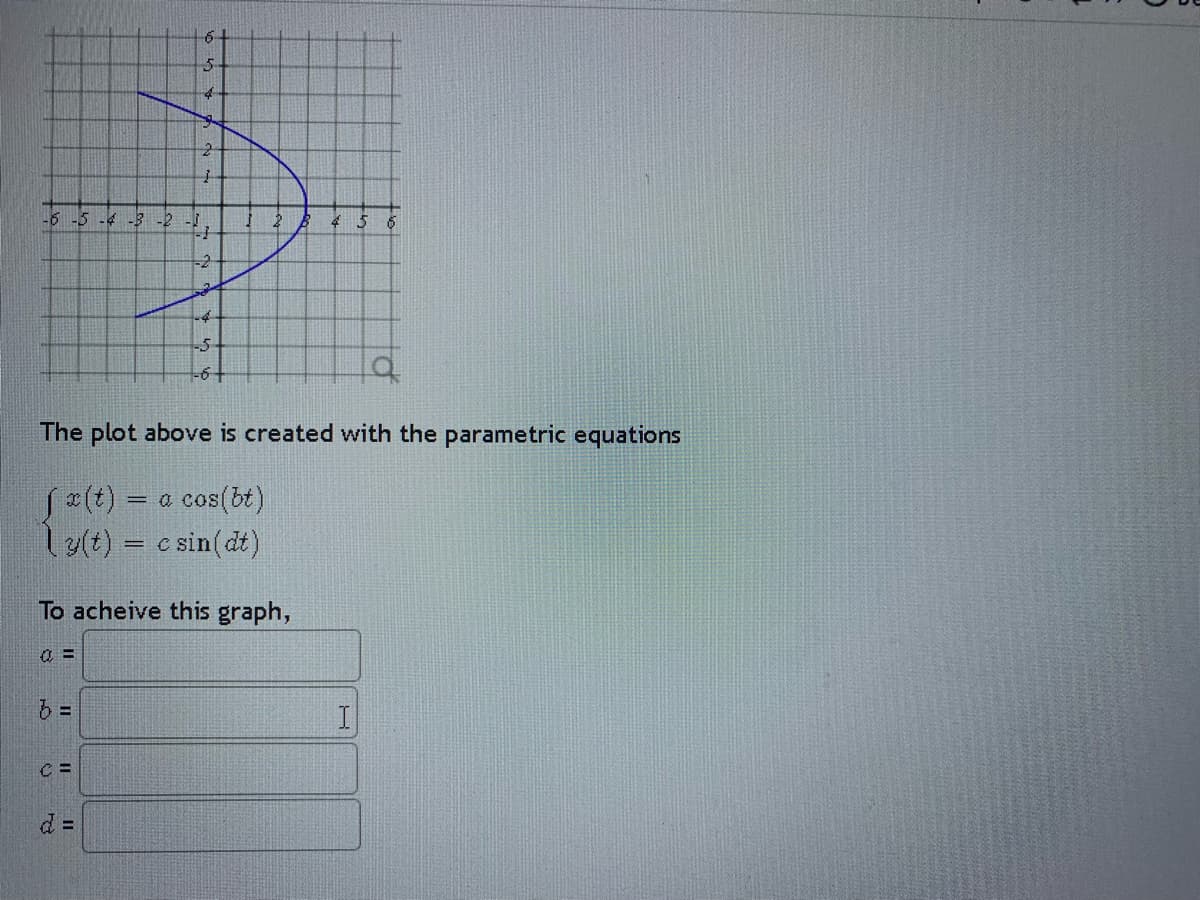
The plot above is created with the parametric equations Sa(t) = a cos(bt) ly(t) = c sin(dt) %3D To acheive this graph, C = d =
The plot above is created with the parametric equations Sa(t) = a cos(bt) ly(t) = c sin(dt) %3D To acheive this graph, C = d =

Algebra & Trigonometry with Analytic Geometry
13th Edition
ISBN:9781133382119
Author:Swokowski
Publisher:Swokowski
Chapter11: Topics From Analytic Geometry
Section: Chapter Questions
Problem 34RE

Related questions
Question
10.9
Transcribed Image Text:6+
5.
-6 -5 -4 -3 -2 -
-2
-4-
-6+
The plot above is created with the parametric equations
S(t)
= a cos(bt)
y(t) = c sin(dt)
To acheive this graph,
Expert Solution
This question has been solved!
Explore an expertly crafted, step-by-step solution for a thorough understanding of key concepts.

This is a popular solution!

Trending now
This is a popular solution!

Step by step
Solved in 4 steps with 1 images

Knowledge Booster


Learn more about
Need a deep-dive on the concept behind this application? Look no further. Learn more about this topic, advanced-math and related others by exploring similar questions and additional content below.Recommended textbooks for you
Algebra & Trigonometry with Analytic Geometry
Algebra
ISBN:
9781133382119
Author:
Swokowski
Publisher:
Cengage

Algebra and Trigonometry (MindTap Course List)
Algebra
ISBN:
9781305071742
Author:
James Stewart, Lothar Redlin, Saleem Watson
Publisher:
Cengage Learning
Algebra & Trigonometry with Analytic Geometry
Algebra
ISBN:
9781133382119
Author:
Swokowski
Publisher:
Cengage
Algebra and Trigonometry (MindTap Course List)
Algebra
ISBN:
9781305071742
Author:
James Stewart, Lothar Redlin, Saleem Watson
Publisher:
Cengage Learning