
Algebra & Trigonometry with Analytic Geometry
13th Edition
ISBN:9781133382119
Author:Swokowski
Publisher:Swokowski
Chapter11: Topics From Analytic Geometry
Section: Chapter Questions
Problem 13RE

Related questions

Concept explainers
Vector Arithmetic
Vectors are those objects which have a magnitude along with the direction. In vector arithmetic, we will see how arithmetic operators like addition and multiplication are used on any two vectors. Arithmetic in basic means dealing with numbers. Here, magnitude means the length or the size of an object. The notation used is the arrow over the head of the vector indicating its direction.
Vector Calculus
Vector calculus is an important branch of mathematics and it relates two important branches of mathematics namely vector and calculus.
Question
Transcribed Image Text:5-
5-43 -2
-2
-6-
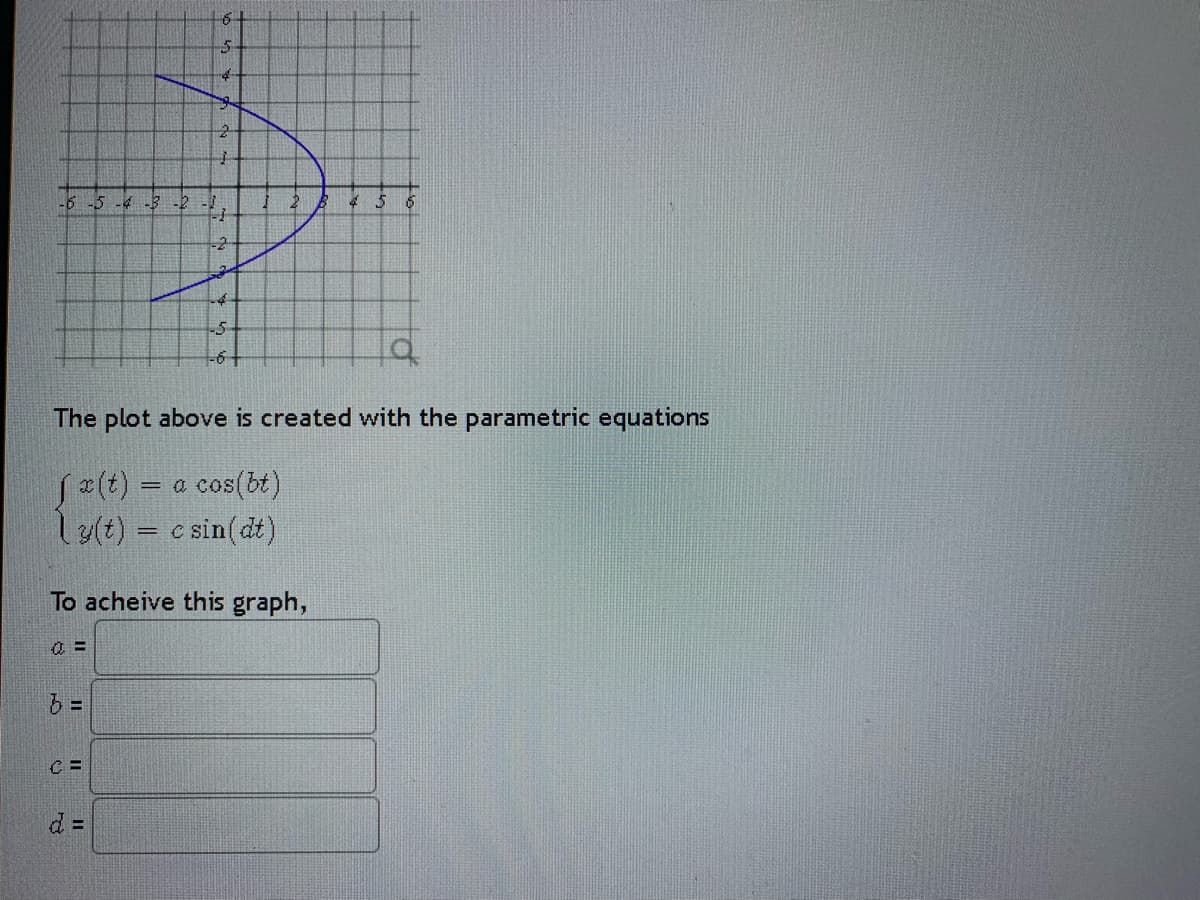
The plot above is created with the parametric equations
= a cos(bt)
ly(t) = c sin(dt)
To acheive this graph,
d =
Expert Solution
This question has been solved!
Explore an expertly crafted, step-by-step solution for a thorough understanding of key concepts.

This is a popular solution!

Trending now
This is a popular solution!

Step by step
Solved in 4 steps with 15 images

Knowledge Booster


Learn more about
Need a deep-dive on the concept behind this application? Look no further. Learn more about this topic, calculus and related others by exploring similar questions and additional content below.Recommended textbooks for you
Algebra & Trigonometry with Analytic Geometry
Algebra
ISBN:
9781133382119
Author:
Swokowski
Publisher:
Cengage
Algebra & Trigonometry with Analytic Geometry
Algebra
ISBN:
9781133382119
Author:
Swokowski
Publisher:
Cengage