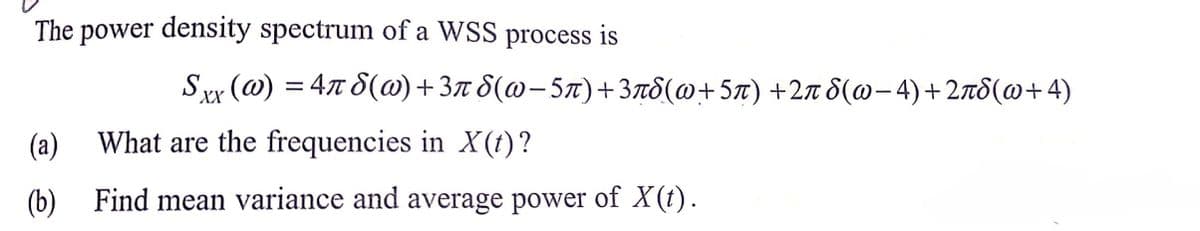
The power density spectrum of a WSS process is Sw (ω) -4π δ(ω) + 3π δ(ω - 5π) + 3πδ(ω+5π) +2π δ(ω- 4)+2πδ(ω+ 4) (а) What are the frequencies in X(t)? (b) Find mean variance and average power of X(t).


Q: -B/ls//E-x] in (6.14) is distributed as at =
A:
Q: Athletes at a certain university have a long term graduation rate of 0.60 or 60%. Researchers…
A: here given, Athletes at a certain university have a long term graduation rate of 0.60 or 60%.…
Q: Explain in (100) words why is that the answer asap
A: Solution: 12. It is to identify the suitable test.
Q: Assessed Land Values A reporter hypothesizes that the average assessed values of land in a large…
A:
Q: You are testing the claim that the proportion of men who own cats is smaller than the proportion of…
A: Formula : Test statistic :
Q: Use f = 0.05 in answering the following. Two-sample test for binomial proportion Test the…
A: Given information:- Streptomycin Saline Died 67 157 Lived 194 104
Q: Find the mean, median, mode and range of this data set: 19, 18, 21, 16, 15, 17, 20, 18.
A: Solution
Q: Based upon the results of the sample in #1, can you say with 95% confidence that your confidence…
A:
Q: Ask 20 of your classmates about their favorite viand among the choices; ADOBO, SINIGANG and MENUDO.…
A:
Q: 9. A number of persons are measured for their heights x, weights y and chest expansion z and product…
A:
Q: 1. What is the probability that out 393 confirmed cases 198 has recovered? a. 198/393 b. 50.38% c.…
A: Note: As for the bartelby guidelines only three sub-parts can be answered. Kindly, repost with note…
Q: Q6. You joined a polling agency as a summer intern. You are helping them answer the following…
A: Given information: Given claim: Do a majority believe raising taxes will help the economy or is…
Q: 6.26 Use Theorem 6.6.5 to establish that, given a sample X1,..., Xn, the following statistics are…
A: Given that -
Q: Find the point estimate of the population parameter and the standard deviation for each of the…
A:
Q: You want to see if it makes a difference which lane to be in when there is traffic. You randomly…
A:
Q: 2. Determine the test to be used. 3. Set the significance level. Determine the tabulated or critical…
A:
Q: What time-series pattern was exemplified during the 1980s when the American economy enjoyed a period…
A: What time-series pattern was exemplified during the 1980s when the American economy enjoyed a period…
Q: By referring to the first graph, the define the type of risks: 1.1. Total Risk. 1.2.…
A: The define the type of risks: Total Risk. Systematic Risk (Non-Diversifiable Risk) Unsystematic…
Q: A chef working at the restaurant randomly selects an avocado and finds it to be substandard.…
A: here AS PER GUIDELINES I HAVE CALCLATED FIRST MAIN QUESTION Avocados from supplier P = A Avocados…
Q: 6.8 Obtain a test for Ho:B = c
A:
Q: The diameter of a brand of tennis balls is approximately normally distributed, with a mean of 2.63…
A: We use standard normal distribution to compute probabilities associated with the normal random…
Q: A manufacturer of office machines is considering the production of a new word processor. The…
A: Use paired t - test distribution, if you have paired measures on the same subject. In our case, we…
Q: 41 Brunci 27 China 45 Georgia India 37 29 Indonesia 49 Iran 47 Japan Kuwait 39 41 Кутдуzstan Lebanon…
A: African countries asian countries
Q: dlo College tuition: The mean annual tuition and fees in the 2013-2014 academic year for a sample of…
A:
Q: 9.State Farm Insurance studies show that in Colorado, 55% of the auto insurance claims submitted for…
A: Binomial probability distribution is a type of discrete probability distribution.
Q: 9. In single-factor experiments (ANOVA), if the design is unbalanced, then..... The experiment can…
A: (D) is correct
Q: Find the P-value = 2 x P (X > 1.58 ), df= v = 18. Use MS Excel. Express your answer to six decimal…
A: From the above data We are given that 2 x P(X ≥ 1.58) , df=v=18 By using MS Excel 2 x P(X ≥…
Q: 6- Use Newton-Raphson method to solve the system x³ + y – 1 = 0 y3 – x + 1 = 0 with the starting…
A:
Q: Construct a confidence interval at a 80% confidence level. Give your answers to one decimal place.…
A: In a survey, 27 people were asked how much they spent on their child's last birthday gift. The…
Q: interpret and compute for the table using w
A: The partial output for the data is displayed below.
Q: The following function represents joint probability density function for the random variables X and…
A: Solution-: Given: G(x,y)=2xy We have the following joint density function f(x,y)=32*x*y2 ;…
Q: Construct the 99% confidence interval for the difference ,-, when x-473.77, x-31743, ,-40.99,…
A:
Q: You simulate the following 35 random values from a distribution: 6 7 11 14 15 17 18 19 25 29 30 34…
A:
Q: Flying over the western states with mountainous terrain in a small aircraft is 40% riskier than…
A:
Q: Compute for 4+ 3X {(-2,-1,0} (X)+ X²I{1,2,3}(X)
A:
Q: An important issue in conservation biology is how dispersal among populations influences the…
A:
Q: Calculate the test-statistic, t with the following information. nį = 25, ã1 = 2.39, s1 = 0.37 20, ã2…
A:
Q: using permutation or combination How many different license plates are possible if each plate…
A: Let us assume there are three persons A, B and C sitting beside each other. The different ways in…
Q: t-value formula
A: In question, We'll write the formula of t-value. The solution is below,
Q: Find 1-a Conf int for P( - tery}u LT L tarziv) =l-a
A:
Q: 1. A random sample of enrollments from medical schools that specialize in research and from those…
A: In hypothesis testing we test the hypothesis regarding population parameter.
Q: 26 Use Theorem 6.6.5 to establish that, given a sample X1,...,Xn, the following statistics are…
A: Given that -
Q: A certain collector is choosing between 4 different paintings to buy. To help him decide, he asked…
A:
Q: Suppose you are to design an experiment for the following problems, identify the independent…
A: 4) IV= Amount of time DV= Anxiety Level Constant = Social Media used ( Facebook, Twitter,…
Q: A control chart is to be started for a new machine that fills boxes of cereal by weight. Five…
A: Solution: As per the guidelines first three parts should be answered. If the remaining parts needed…
Q: Can the economist conclude that the mean FICO score is greater than 720
A: Given: Sample size,n=120Population mean μ=720Sample meanx¯=740Sample standard deviation…
Q: Do the following as indicated: (Use the data below) 1. Report the assumption check and its…
A: 1. Assumptions, interpretation and tests: The assumptions of Multiple Regression Model are as…
Q: The spectral density of a WSS random process X(1) is given by Sxx (@) XX o* +13@ + 36 Find the…
A:
Q: To estimate the proportion of smoker a sample of 100 men was selected. In the selected sample, 60…
A:
Q: Solve the following problems. Show your complete solutions and interpret the results on a separate…
A: It seems that, there is a typo in the upper limit of the second class limit. It should be 50 instead…

Step by step
Solved in 2 steps with 2 images

- A discrete random variable X has probability mass function X 0 1 2 3 4 P(x) 0.1 0.2 0.2 0.2 0.3 Use the inverse transform method to generate a random sample of size 1000 from the distribution of X. Construct a relative frequency table and compare with the theoretical values.1)Let x be a random variable Gaussian with zero mean and variance 1. Find:a)The conditional pdf and pdf of x given x > 0;b)E [ x| x>0 ]c)Var [ x | x >0]continuous random variables Z is known to have an Erlang (2,1.3) type PDF. what is the variance of Z ?
- Suppose that the continuous two-dimensional random variable (X, Y ) is uniformly distributed over the square whose vertices are (1, 0), (0, 1), (−1, 0), and (0, −1). Find the Correlation Coefficient ρxyX1 and X2 are two discrete random variables, while the X1 random variable takes the values x1 = 1, x1 = 2 and x1 = 3, while the X2 random variable takes the values x2 = 10, x2 = 20 and x2 = 30. The combined probability mass function of the random variables X1 and X2 (pX1, X2 (x1, x2)) is given in the table below a) Find the marginal probability mass function (pX1 (X1)) of the random variable X1.b) Find the marginal probability mass function (pX2 (X2)) of the random variable X2.c) Find the expected value of the random variable X1.d) Find the expected value of the random variable X2.e) Find the variance of the random variable X1.f) Find the variance of the random variable X2.g) pX1 | X2 (x1 | x2 = 10) Find the mass function of the given conditional probability.h) pX2 | X1 (x2 | x1 = 2) Find the mass function of the given conditional probability.i) Are the random variables X1 and X2 independent? Show it. The combined probability mass function of the random variables X1 and X2 is belowLet x be a random n-vector with mean mu and positive definite variancecovariance matrix Sigma. Define Sigma^(-(1)/(2))=(Sigma^((1)/(2)))^(-1). (a) Show that Sigma^(-(1)/(2))(x-mu) has mean 0 and variance-covariance matrix I. (b) Determine E[(x-mu)^(T)Sigma^(-1)(x-mu)] and var[(x-mu)^(T)Sigma^(-1)(x-mu)], assuming for the latter that the skewness matrix Lambda and excess kurtosis matrix Omega of x exist.
- 13) Random variables X and Y have joint pdf fXY={4xy, 0≤x≤1, 0≤y≤1fXY={4xy, 0≤x≤1, 0≤y≤1 Find Correlation and CovarianceLet random sample from a Poisson distribution with parameter . A random variable X with Poisson distribution has a probability mass function (pmf) of p(x; lambda)=((lambda^x)(e^-lambda))/x!, x=0,1,... with E(X)=lambda and Var(X)=lambda . (d) Find the Fisher information for the random sample of the parameter lambda. (e) What is the Cramer Rao Lower bound for an unbiased estimator of the parameter lambda? (f) Is the MLE of part (c) a minimum variance unbiased estimator (MVUE) of lambda?Let x be a continuous random variable with the density function: f(x) = 3e-3x when x>0 and 0 else Find the variance of the random variable x.
- Let X and Y be independent Gaussian random variables, each distributed according to (0, σ2). 1. Find the joint density function of the random variables Z = X + Y and W = 2X −Y . What is the correlation coefficient between these two random variables1. Perform the singular value decomposition of A and the spectral decomposition of variance(A) You can use R (but please do it without using the svd function).The random variable X has a Bernoulli distribution with parameter p. A random sampleX1, X2, . . . , Xn of size n is taken of X. Show that the sample proportionX1 + X2 + · · · + Xnnis a minimum variance unbiased estimator of p.Given that X1, X2, . . . , Xn forms a random sample of size n from a geometric population withparameter p, show thatY =n∑j=1