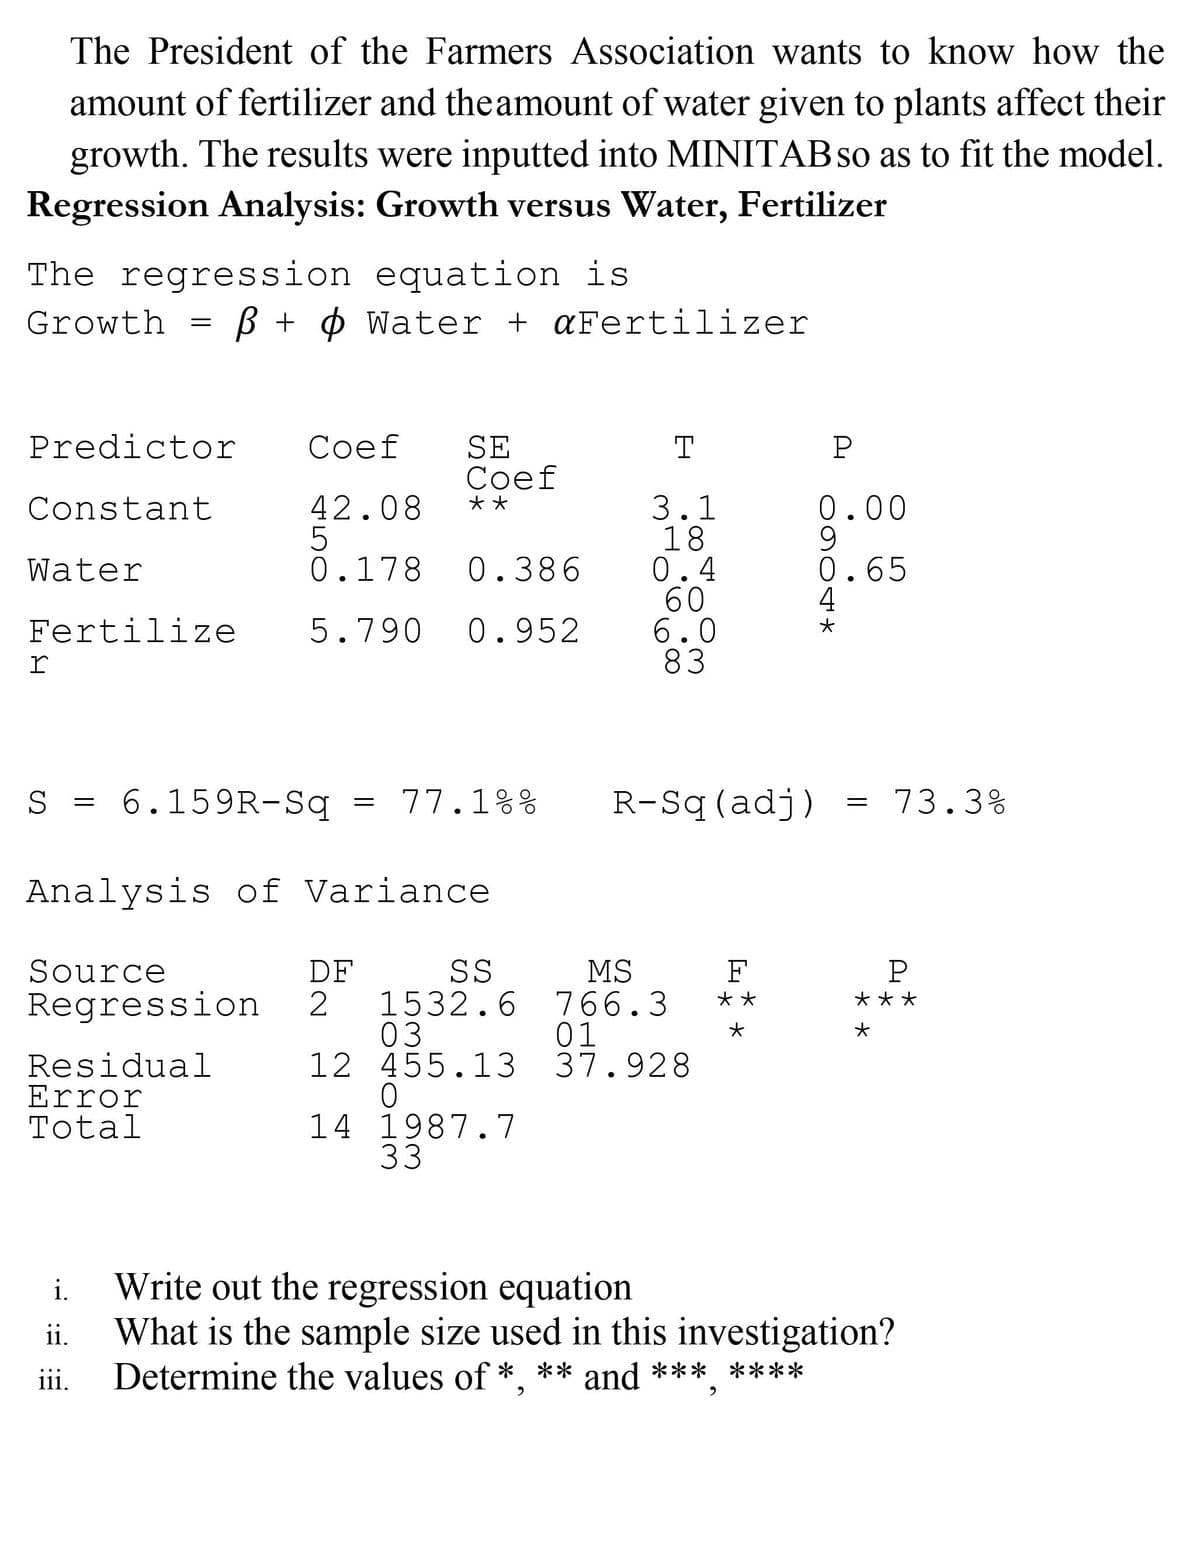
The President of the Farmers Association wants to know how the amount of fertilizer and theamount of water given to plants affect their growth. The results were inputted into MINITAB so as to fit the model. Regression Analysis: Growth versus Water, Fertilizer The regression equation is Growth = ß + ¢ Water + aFertilizer Predictor Coef SE Соef T P 3.1 18 0.4 60 6.0 83 42.08 0.00 Constant *大 0.386 0.65 4 Water 0.178 Fertilize 5.790 0.952 r S = 6.159R-Sq 77.1%% R-Sq (adj) 73.3% Analysis of Variance Source SS 1532.6 766.3 01 12 455.13 37.928 DF MS F P *** Regression ** 03 Residual Error Total 14 1987.7 33 Write out the regression equation What is the sample size used in this investigation? Determine the values of *, i. ii. iii. * ** and *** ****
The President of the Farmers Association wants to know how the amount of fertilizer and theamount of water given to plants affect their growth. The results were inputted into MINITAB so as to fit the model. Regression Analysis: Growth versus Water, Fertilizer The regression equation is Growth = ß + ¢ Water + aFertilizer Predictor Coef SE Соef T P 3.1 18 0.4 60 6.0 83 42.08 0.00 Constant *大 0.386 0.65 4 Water 0.178 Fertilize 5.790 0.952 r S = 6.159R-Sq 77.1%% R-Sq (adj) 73.3% Analysis of Variance Source SS 1532.6 766.3 01 12 455.13 37.928 DF MS F P *** Regression ** 03 Residual Error Total 14 1987.7 33 Write out the regression equation What is the sample size used in this investigation? Determine the values of *, i. ii. iii. * ** and *** ****

College Algebra
7th Edition
ISBN:9781305115545
Author:James Stewart, Lothar Redlin, Saleem Watson
Publisher:James Stewart, Lothar Redlin, Saleem Watson
Chapter1: Equations And Graphs
Section: Chapter Questions
Problem 10T: Olympic Pole Vault The graph in Figure 7 indicates that in recent years the winning Olympic men’s...

Related questions
Question
NO handwriting please
Transcribed Image Text:The President of the Farmers Association wants to know how the
amount of fertilizer and the amount of water given to plants affect their
growth. The results were inputted into MINITABSO as to fit the model.
Regression Analysis: Growth versus Water, Fertilizer
The regression equation is
Growth
B + ¢ Water + aFertilizer
Predictor
Соef
SE
Соef
T
P
42.08
3.1
18
0.4
60
6.0
83
Constant
**
0.00
0.386
0.65
4
Water
0.178
Fertilize
5.790
0.952
r
S
6.159R-Sg
77.1%%
R-Sq(adj)
73.3%
Analysis of Variance
Source
DF
SS
MS
F
P
1532.6 766.3
03
12 455.13 37.928
**
***
Regression
01
Residual
Error
Total
14 1987.7
33
Write out the regression equation
What is the sample size used in this investigation?
Determine the values of *, ** and *** ****
i.
ii.
iii.
Expert Solution
This question has been solved!
Explore an expertly crafted, step-by-step solution for a thorough understanding of key concepts.

Step by step
Solved in 4 steps with 3 images

Recommended textbooks for you
College Algebra
Algebra
ISBN:
9781305115545
Author:
James Stewart, Lothar Redlin, Saleem Watson
Publisher:
Cengage Learning

Glencoe Algebra 1, Student Edition, 9780079039897…
Algebra
ISBN:
9780079039897
Author:
Carter
Publisher:
McGraw Hill
College Algebra
Algebra
ISBN:
9781305115545
Author:
James Stewart, Lothar Redlin, Saleem Watson
Publisher:
Cengage Learning
Glencoe Algebra 1, Student Edition, 9780079039897…
Algebra
ISBN:
9780079039897
Author:
Carter
Publisher:
McGraw Hill