The probability distribution table shows the proportion of people living in the five different regions of a city. There are now 24,200 residents in the city. How many live in the Central region? X P O South 0.14 4840 12,100 24,200 10,648 North Central East West 0.12 0.44 0.12 0.18
The probability distribution table shows the proportion of people living in the five different regions of a city. There are now 24,200 residents in the city. How many live in the Central region? X P O South 0.14 4840 12,100 24,200 10,648 North Central East West 0.12 0.44 0.12 0.18

Chapter8: Sequences, Series,and Probability
Section8.7: Probability
Problem 4ECP: Show that the probability of drawing a club at random from a standard deck of 52 playing cards is...

Related questions
Question
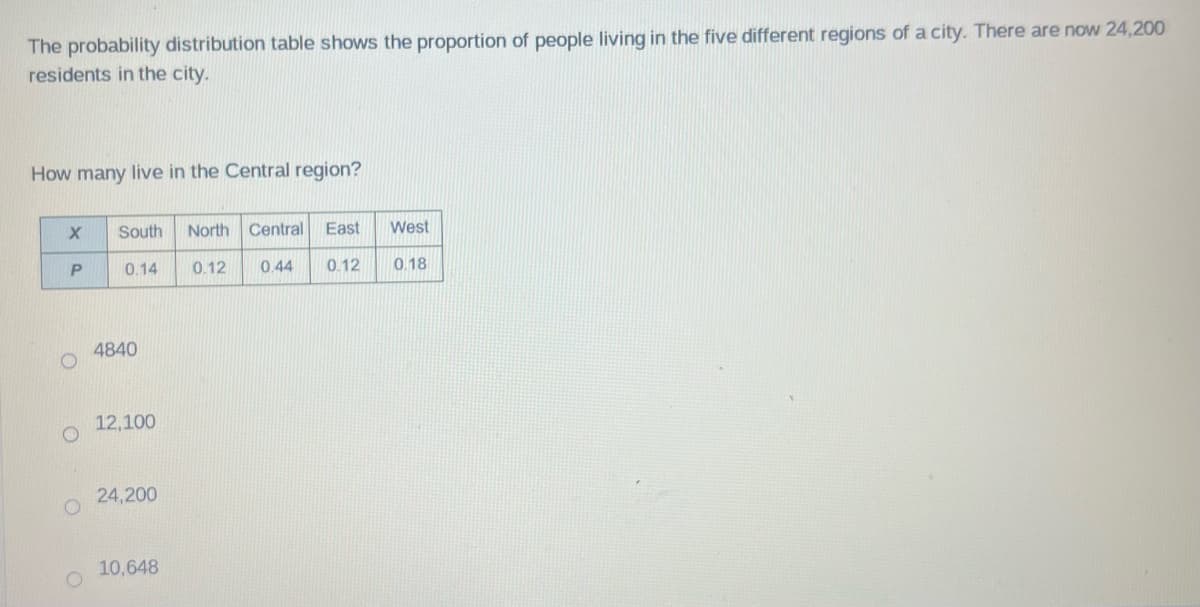
The probability distribution table shows the proportion of people living in the five different regions of a city. There are now 24,200 residents in the city.
How many live in the Central region?
Transcribed Image Text:The probability distribution table shows the proportion of people living in the five different regions of a city. There are now 24,200
residents in the city.
How many live in the Central region?
X
P
O
South
0.14
4840
12,100
24,200
10,648
North Central East West
0.12 0.44 0.12 0.18
Expert Solution
This question has been solved!
Explore an expertly crafted, step-by-step solution for a thorough understanding of key concepts.

This is a popular solution!

Trending now
This is a popular solution!

Step by step
Solved in 3 steps with 3 images

Recommended textbooks for you

College Algebra (MindTap Course List)
Algebra
ISBN:
9781305652231
Author:
R. David Gustafson, Jeff Hughes
Publisher:
Cengage Learning

Holt Mcdougal Larson Pre-algebra: Student Edition…
Algebra
ISBN:
9780547587776
Author:
HOLT MCDOUGAL
Publisher:
HOLT MCDOUGAL
College Algebra (MindTap Course List)
Algebra
ISBN:
9781305652231
Author:
R. David Gustafson, Jeff Hughes
Publisher:
Cengage Learning
Holt Mcdougal Larson Pre-algebra: Student Edition…
Algebra
ISBN:
9780547587776
Author:
HOLT MCDOUGAL
Publisher:
HOLT MCDOUGAL