The probability of an economic decline in a certain year is 0.21. There is a probability of 0.61 that we will elect a republican president in the same year. If we elect a republican president, there is a 0.34 probability of an economic decline. Let D represent the event of an economic decline and R represent the event of election of a Republican president. (a) Are R and D independent events? O Yes, because P(D) * P(D|R). O Yes, because P(D) = P(D|IR). O No, because P(D) + P(DIR). O No, because P(D) = P(D|R). (b) What is the probability of a Republican president and economic decline in the year? (c) If we experience an economic decline in the year, what is the probability that there will a Republican president? (Round your answer to four decimal places.) (d) What is the probability of economic decline or a Republican president in the year? Hint: You want to find P(D U R).
The probability of an economic decline in a certain year is 0.21. There is a probability of 0.61 that we will elect a republican president in the same year. If we elect a republican president, there is a 0.34 probability of an economic decline. Let D represent the event of an economic decline and R represent the event of election of a Republican president. (a) Are R and D independent events? O Yes, because P(D) * P(D|R). O Yes, because P(D) = P(D|IR). O No, because P(D) + P(DIR). O No, because P(D) = P(D|R). (b) What is the probability of a Republican president and economic decline in the year? (c) If we experience an economic decline in the year, what is the probability that there will a Republican president? (Round your answer to four decimal places.) (d) What is the probability of economic decline or a Republican president in the year? Hint: You want to find P(D U R).

Elementary Linear Algebra (MindTap Course List)
8th Edition
ISBN:9781305658004
Author:Ron Larson
Publisher:Ron Larson
Chapter2: Matrices
Section2.5: Markov Chain
Problem 16E: Consumer Preference In a population of 100,000 consumers, there are 20,000 users of Brand A, 30,000...

Related questions

Concept explainers
Contingency Table
A contingency table can be defined as the visual representation of the relationship between two or more categorical variables that can be evaluated and registered. It is a categorical version of the scatterplot, which is used to investigate the linear relationship between two variables. A contingency table is indeed a type of frequency distribution table that displays two variables at the same time.
Binomial Distribution
Binomial is an algebraic expression of the sum or the difference of two terms. Before knowing about binomial distribution, we must know about the binomial theorem.
Topic Video
Question
Help :)
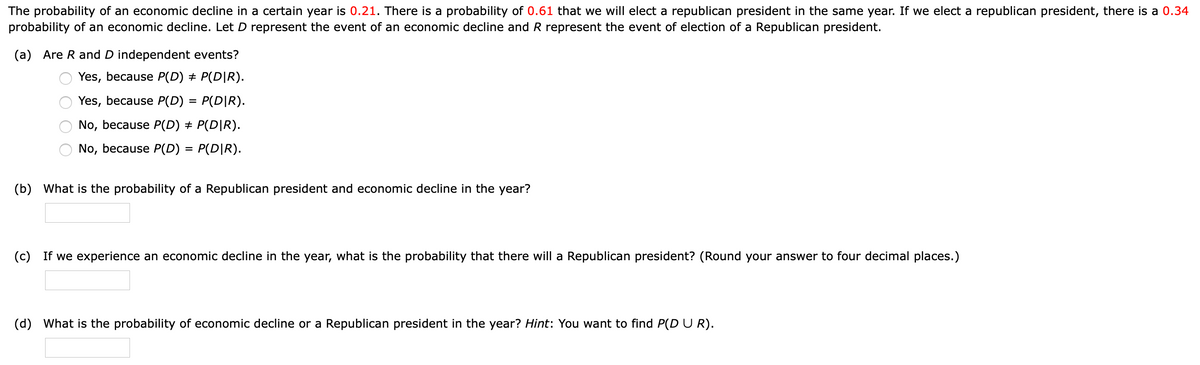
Transcribed Image Text:The probability of an economic decline in a certain year is 0.21. There is a probability of 0.61 that we will elect a republican president in the same year. If we elect a republican president, there is a 0.34
probability of an economic decline. Let D represent the event of an economic decline and R represent the event of election of a Republican president.
(a) Are R and D independent events?
Yes, because P(D) + P(D|R).
Yes, because P(D) = P(D|R).
No, because P(D) + P(D|R).
No, because P(D) =
P(D|R).
(b) What is the probability of a Republican president and economic decline in the year?
(c) If we experience an economic decline in the year, what is the probability that there will a Republican president? (Round your answer to four decimal places.)
(d) What is the probability of economic decline or a Republican president in the year? Hint: You want to find P(D U R).
O O O O
Expert Solution
This question has been solved!
Explore an expertly crafted, step-by-step solution for a thorough understanding of key concepts.

This is a popular solution!

Trending now
This is a popular solution!

Step by step
Solved in 2 steps

Knowledge Booster


Learn more about
Need a deep-dive on the concept behind this application? Look no further. Learn more about this topic, statistics and related others by exploring similar questions and additional content below.Recommended textbooks for you
Elementary Linear Algebra (MindTap Course List)
Algebra
ISBN:
9781305658004
Author:
Ron Larson
Publisher:
Cengage Learning

Holt Mcdougal Larson Pre-algebra: Student Edition…
Algebra
ISBN:
9780547587776
Author:
HOLT MCDOUGAL
Publisher:
HOLT MCDOUGAL

College Algebra
Algebra
ISBN:
9781305115545
Author:
James Stewart, Lothar Redlin, Saleem Watson
Publisher:
Cengage Learning
Elementary Linear Algebra (MindTap Course List)
Algebra
ISBN:
9781305658004
Author:
Ron Larson
Publisher:
Cengage Learning
Holt Mcdougal Larson Pre-algebra: Student Edition…
Algebra
ISBN:
9780547587776
Author:
HOLT MCDOUGAL
Publisher:
HOLT MCDOUGAL
College Algebra
Algebra
ISBN:
9781305115545
Author:
James Stewart, Lothar Redlin, Saleem Watson
Publisher:
Cengage Learning