The problem facing a manager is to assess the impact of factors on full-time (FT) job growth. Specifically, the manager is interest in the impact of total worldwide revenues and full-time voluntary turnover on the number of full-ime jobs added in a year. Data were collected from a sample of 20 best companies to work for." The data indludes the total number of full-time jobs added in the past year, total worldwide revenue (in Smilions), and the ful-time voluntary turnover (%). Use the accompanying data to complete parts (a) through (4) below. H Cick the icon to view the data table. a. State the multiple regrossion equation. Let X, represent the Total Worldwide Revenues (Smillions) and let Xg represent the FT Voluntary Turmover (%6). (Round the constant and X coefcient to the nearest integer as needed. Round the X,-coefcient to four decimal places as needed.) b. Interpret the meanings of the slopes by and by in this problem. Choose the correct answer below. OA. The slopes b, and by cannot be interpreted individually. OB. For each increase of 1 in Jobs Added, the Revenue is estimated to increase by Sb, million and the Turmover percentage is estimated to increase by by %. OC. For each increase of 1 in both Revenue and Tumover, the Jobs Added ia estimated to increase by b, + bz. OD. For a given Turnover, for each increase of $1 million in Revenue, the Jobs Added is estimated to increase by b,. For a given Revenue, for each increase 1% in Tumover, the number of Jobs Added is estimated to increase by by
The problem facing a manager is to assess the impact of factors on full-time (FT) job growth. Specifically, the manager is interest in the impact of total worldwide revenues and full-time voluntary turnover on the number of full-ime jobs added in a year. Data were collected from a sample of 20 best companies to work for." The data indludes the total number of full-time jobs added in the past year, total worldwide revenue (in Smilions), and the ful-time voluntary turnover (%). Use the accompanying data to complete parts (a) through (4) below. H Cick the icon to view the data table. a. State the multiple regrossion equation. Let X, represent the Total Worldwide Revenues (Smillions) and let Xg represent the FT Voluntary Turmover (%6). (Round the constant and X coefcient to the nearest integer as needed. Round the X,-coefcient to four decimal places as needed.) b. Interpret the meanings of the slopes by and by in this problem. Choose the correct answer below. OA. The slopes b, and by cannot be interpreted individually. OB. For each increase of 1 in Jobs Added, the Revenue is estimated to increase by Sb, million and the Turmover percentage is estimated to increase by by %. OC. For each increase of 1 in both Revenue and Tumover, the Jobs Added ia estimated to increase by b, + bz. OD. For a given Turnover, for each increase of $1 million in Revenue, the Jobs Added is estimated to increase by b,. For a given Revenue, for each increase 1% in Tumover, the number of Jobs Added is estimated to increase by by

Linear Algebra: A Modern Introduction
4th Edition
ISBN:9781285463247
Author:David Poole
Publisher:David Poole
Chapter7: Distance And Approximation
Section7.3: Least Squares Approximation
Problem 31EQ

Related questions
Topic Video
Question
100%
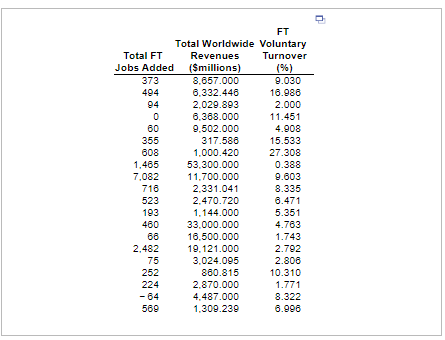
Transcribed Image Text:FT
Total Worldwide Voluntary
Total FT
Revenues
Turnover
Jobs Added ($millions)
373
(%)
8,657.000
9.030
494
6,332.448
18.986
94
2,029.893
2.000
6.368.000
11.451
60
9.502.000
4.908
355
317.586
15.533
608
1,000.420
27.308
1.465
53.300.000
0.388
7,082
11,700.000
9.603
718
2,331.041
8.335
523
2,470.720
6.471
193
1.144.000
5.351
460
33,000.000
4.763
66
16,500.000
1.743
2,482
19.121.000
2.792
75
3,024.095
2.808
10.310
252
880.815
224
2,870.000
1.771
- 64
4,487.000
8.322
569
1,309.230
6.996
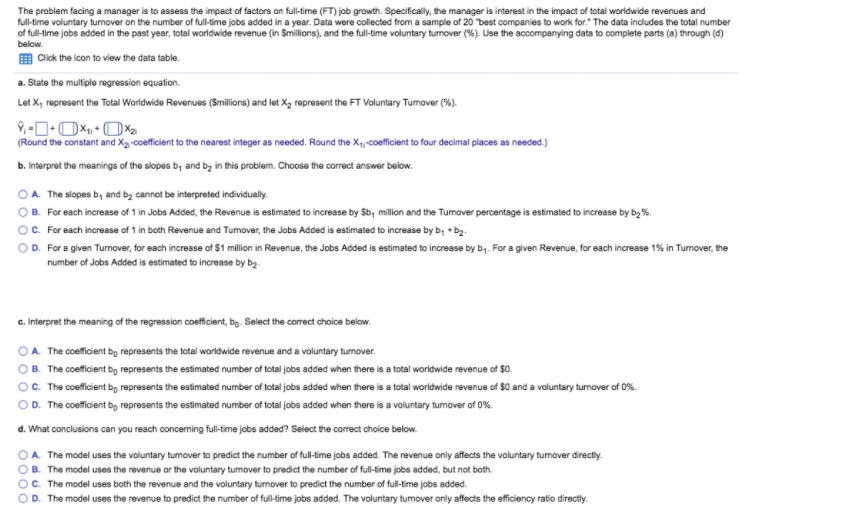
Transcribed Image Text:The problem facing a manager is to assess the impact of factors on full-time (FT) job growth. Specifically, the manager is interest in the impact of total worldwide revenues and
full-time voluntary turnover on the number of full-time jobs added in a year. Data were collected from a sample of 20 "best companies to work for." The data includes the total number
of full-time jobs added in the past year, total worldwide revenue (in Smillions), and the full-time voluntary turnover (%). Use the accompanying data to complete parts (a) through (d)
below.
E Click the icon to view the data table.
a. State the multiple regression equation.
Let X, represent the Total Worldwide Revenues (Smillions) and let X, represent the FT Voluntary Tumover (%).
(Round the constant and Xg-coeficient to the nearest integer as needed. Round the X-coeficient to four decimal places as needed.)
b. Interpret the meanings of the slopes b, and bz in this problem. Choose the correct answer below.
OA. The slopes b, and bz cannot be interpreted individually.
OB. For each increase of 1 in Jobs Added, the Revenue is estimated to increase by Sb, milion and the Tumover percentage is estimated to increase by by%.
OC. For each increase of 1 in both Revenue and Turnover, the Jobs Added is estimated to increase by b; +b.
OD. For a given Turnover, for each increase of $1 million in Revenue, the Jobs Added is estimated to increase by by. For a given Revenue, for each increase 1% in Tumover, the
number of Jobs Added is estimated to increase by bg.
c. Interpret the meaning of the regression coeficient, bọ. Select the correct choice below.
OA. The coeficient bo represents the total worldwide revenue and a voluntary turnover.
OB. The coeficient bg represents the estimated number of total jobs added when there is a total worldwide revenue of $0.
O. The coeficient bo represents the estimated number of total jobs added when there is a total worldwide revenue of $0 and a voluntary turnover of 0%.
OD. The coeficient bg represents the estimated number of total jobs added when there is a voluntary turnover of 0%.
d. What conclusions can you reach conceming fulltime jobs added? Select the correct choice below.
O A. The model uses the voluntary turmover to predict the number of full-time jobs added. The revenue only affects the voluntary turnover directiy.
O B. The model uses the revenue or the voluntary tumover to predict the number of full-time jobs added, but not both.
OC. The model uses both the revenue and the voluntary turnover to predict the number of full-time jobs added.
OD. The model uses the revenue to predict the number of full-time jobs added. The voluntary tumover only affects the efficiency ratio directly.
Expert Solution
This question has been solved!
Explore an expertly crafted, step-by-step solution for a thorough understanding of key concepts.

This is a popular solution!

Trending now
This is a popular solution!

Step by step
Solved in 3 steps with 2 images

Knowledge Booster


Learn more about
Need a deep-dive on the concept behind this application? Look no further. Learn more about this topic, statistics and related others by exploring similar questions and additional content below.Recommended textbooks for you
Linear Algebra: A Modern Introduction
Algebra
ISBN:
9781285463247
Author:
David Poole
Publisher:
Cengage Learning

Big Ideas Math A Bridge To Success Algebra 1: Stu…
Algebra
ISBN:
9781680331141
Author:
HOUGHTON MIFFLIN HARCOURT
Publisher:
Houghton Mifflin Harcourt

Glencoe Algebra 1, Student Edition, 9780079039897…
Algebra
ISBN:
9780079039897
Author:
Carter
Publisher:
McGraw Hill
Linear Algebra: A Modern Introduction
Algebra
ISBN:
9781285463247
Author:
David Poole
Publisher:
Cengage Learning
Big Ideas Math A Bridge To Success Algebra 1: Stu…
Algebra
ISBN:
9781680331141
Author:
HOUGHTON MIFFLIN HARCOURT
Publisher:
Houghton Mifflin Harcourt
Glencoe Algebra 1, Student Edition, 9780079039897…
Algebra
ISBN:
9780079039897
Author:
Carter
Publisher:
McGraw Hill