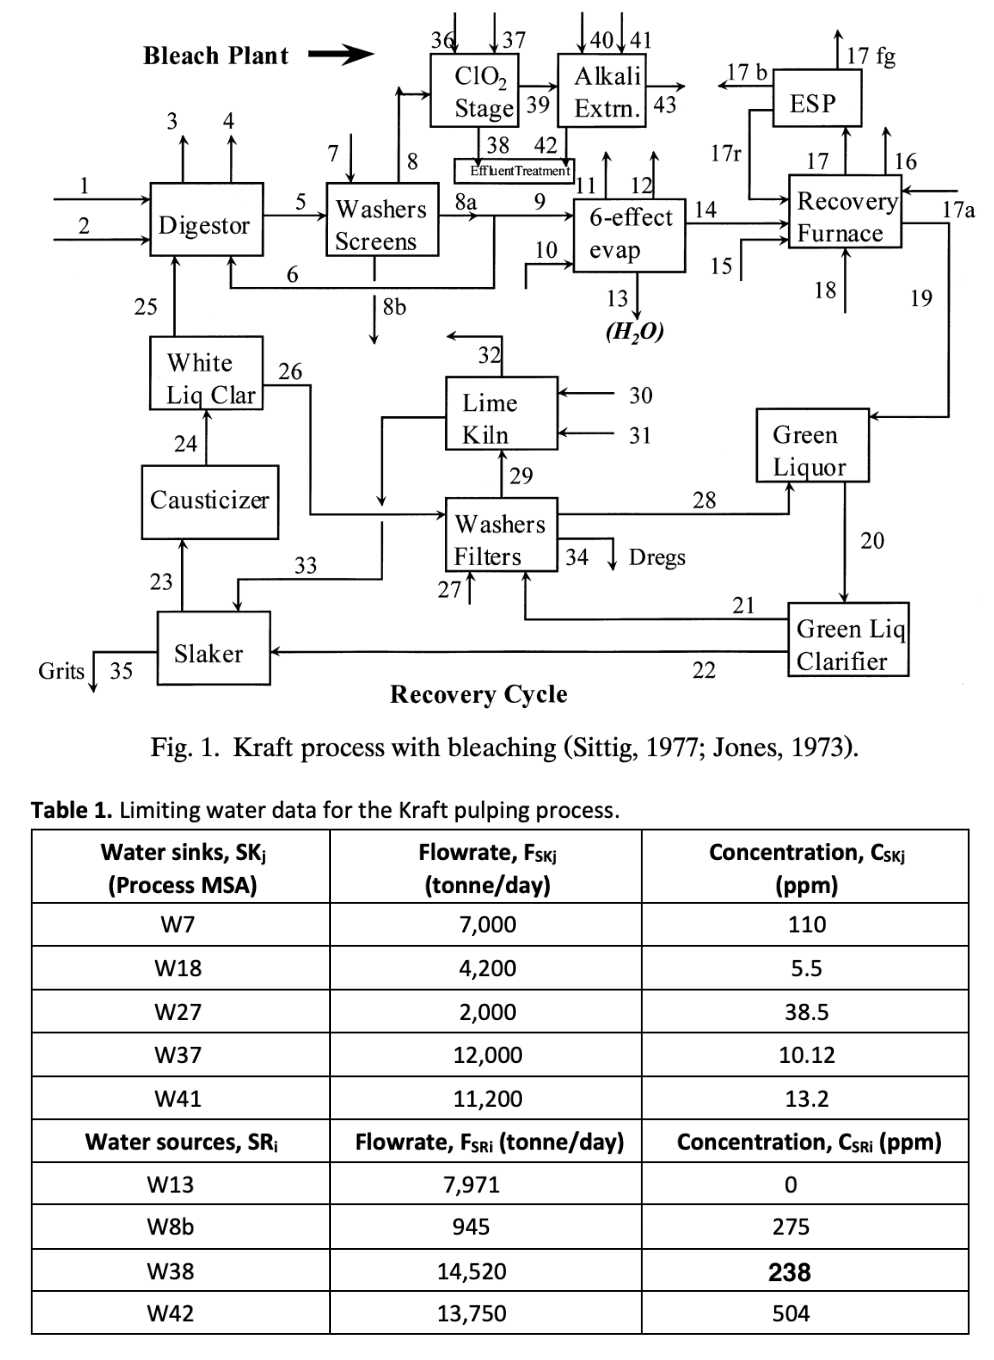
The process for large-scale manufacture of paper has been largely unchanged for the last 125 years. The pulp and paper industry today is highly capital intensive, and there is an ongoing drive towards process integration, thereby increasing the efficiency of utilization of available process resources. This paper deals with the Kraft process (see Fig. 1) though the general principles described can be extended to other pulping processes. As shown in Figure 1, five water sinks and four water sources are considered for in-plant water reuse/ recycle. Prior to water reuse/ recycle, the network requires a freshwater flow rate of 36,400 tonne/day and generates 37,186 tonne/day of wastewater (sum of the individual sink and source flow rates in Table 1). The freshwater source that is available for service has an impurity concentration (chloride content) of 4.2 ppm, which is higher than the purest process source W13 (0 ppm). Please refer to first image for the schematic diagram and table of values, then answer this: Task A-1: Determine the minimum fresh water and minimum wastewater targets for the above system using water cascade analysis (WCA). [30%] Task A-2 [ULO2] Based on the results obtained from Task A-1, redraw Figure 1 for this Kraft pulping process (You are required to draw the water network for this Kraft pulping process first). Task A-2: Based on the results obtained from Task A-1, redraw Figure 1 for this Kraft pulping process (You are required to draw the water network for this Kraft pulping process first). Note: Refer to the 2nd photo for the examples and guides.


Answer the two connected questions (Task A-1 and A-2). Provided in the last part are the guides and examples:
The process for large-scale manufacture of paper has been largely unchanged for the last 125 years. The pulp and paper industry today is highly capital intensive, and there is an ongoing drive towards process integration, thereby increasing the efficiency of utilization of available process resources. This paper deals with the Kraft process (see Fig. 1) though the general principles described can be extended to other pulping processes. As shown in Figure 1, five water sinks and four water sources are considered for in-plant water reuse/ recycle. Prior to water reuse/ recycle, the network requires a freshwater flow rate of 36,400 tonne/day and generates 37,186 tonne/day of wastewater (sum of the individual sink and source flow rates in Table 1). The freshwater source that is available for service has an impurity concentration (chloride content) of 4.2 ppm, which is higher than the purest process source W13 (0 ppm).
Please refer to first image for the schematic diagram and table of values, then answer this:
Task A-1: Determine the minimum fresh water and minimum wastewater targets for the above system using water cascade analysis (WCA). [30%] Task A-2 [ULO2] Based on the results obtained from Task A-1, redraw Figure 1 for this Kraft pulping process (You are required to draw the water network for this Kraft pulping process first).
Task A-2: Based on the results obtained from Task A-1, redraw Figure 1 for this Kraft pulping process (You are required to draw the water network for this Kraft pulping process first).
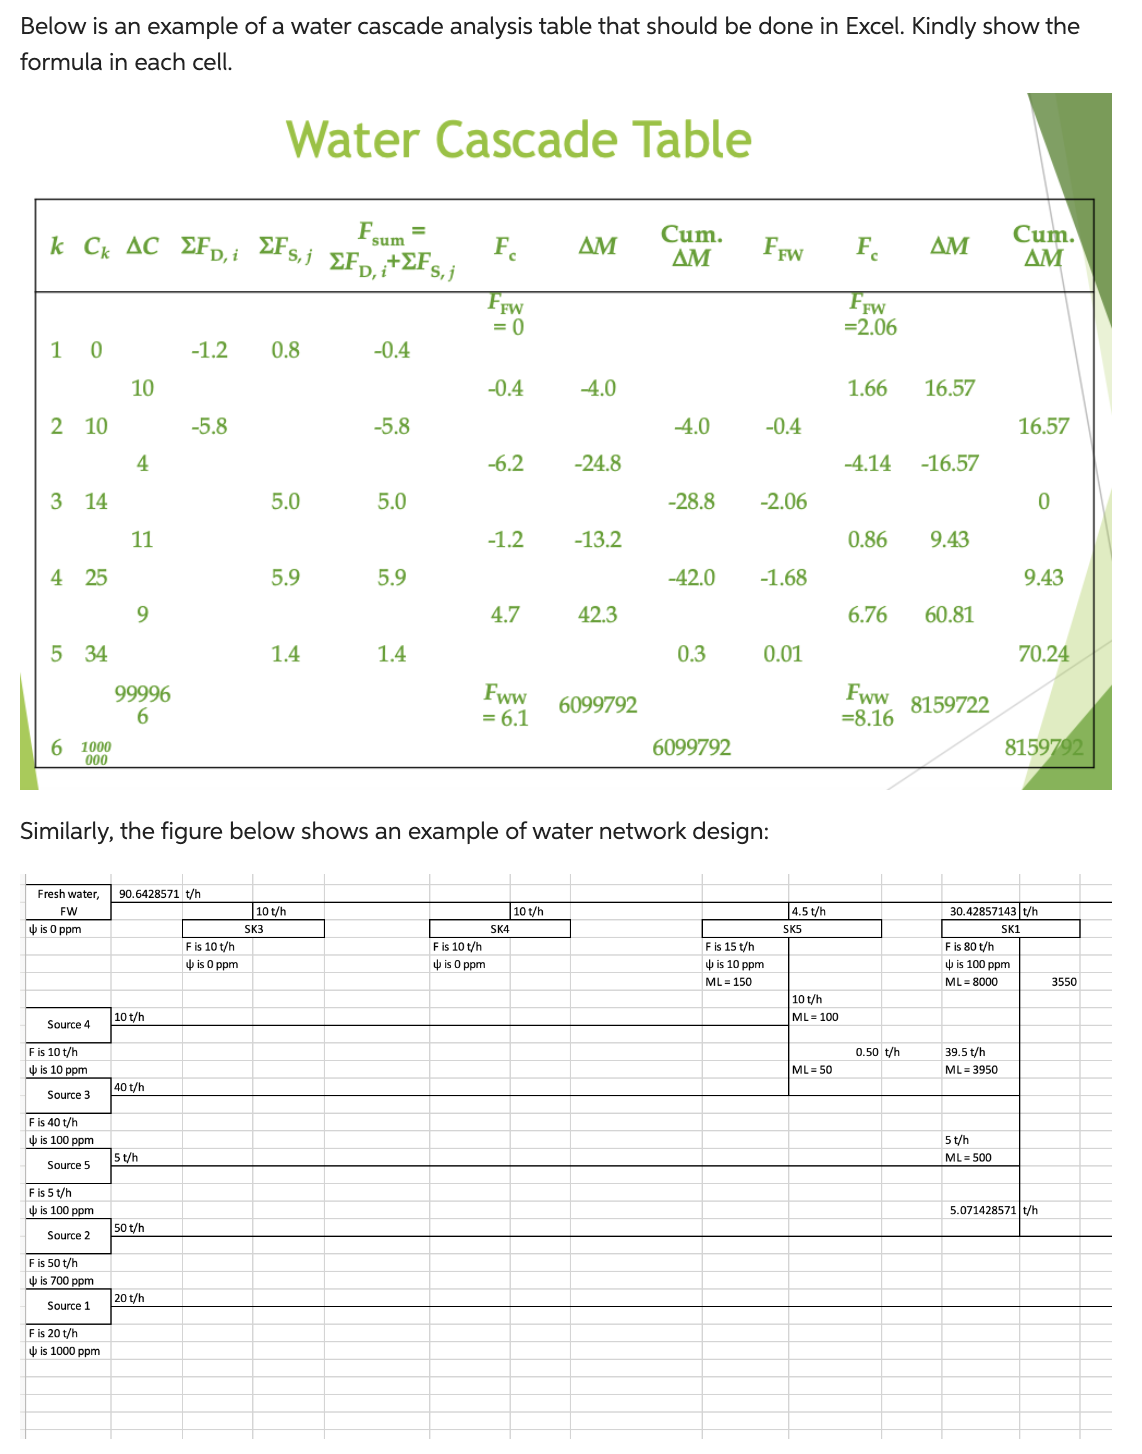
Note: Refer to the 2nd photo for the examples and guides.

Step by step
Solved in 3 steps with 2 images


