The proportion of the total incidence of stroke in left hand batters that is attributable to being left handed is: O 1.24% 4.1% 39.4%
The proportion of the total incidence of stroke in left hand batters that is attributable to being left handed is: O 1.24% 4.1% 39.4%

Holt Mcdougal Larson Pre-algebra: Student Edition 2012
1st Edition
ISBN:9780547587776
Author:HOLT MCDOUGAL
Publisher:HOLT MCDOUGAL
Chapter11: Data Analysis And Probability
Section: Chapter Questions
Problem 8CR

Related questions
Question
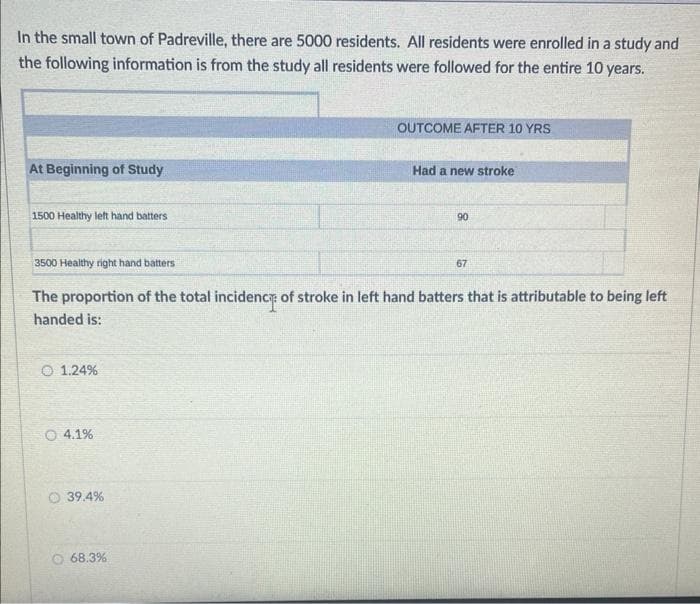
Transcribed Image Text:In the small town of Padreville, there are 5000 residents. All residents were enrolled in a study and
the following information is from the study all residents were followed for the entire 10 years.
At Beginning of Study
1500 Healthy left hand batters
O 1.24%
4.1%
3500 Healthy right hand battersi
The proportion of the total incidence of stroke in left hand batters that is attributable to being left
handed is:
39.4%
OUTCOME AFTER 10 YRS
68.3%
Had a new stroke
90
67
Expert Solution
This question has been solved!
Explore an expertly crafted, step-by-step solution for a thorough understanding of key concepts.

Step by step
Solved in 2 steps with 2 images

Recommended textbooks for you
Holt Mcdougal Larson Pre-algebra: Student Edition…
Algebra
ISBN:
9780547587776
Author:
HOLT MCDOUGAL
Publisher:
HOLT MCDOUGAL

Glencoe Algebra 1, Student Edition, 9780079039897…
Algebra
ISBN:
9780079039897
Author:
Carter
Publisher:
McGraw Hill
Holt Mcdougal Larson Pre-algebra: Student Edition…
Algebra
ISBN:
9780547587776
Author:
HOLT MCDOUGAL
Publisher:
HOLT MCDOUGAL
Glencoe Algebra 1, Student Edition, 9780079039897…
Algebra
ISBN:
9780079039897
Author:
Carter
Publisher:
McGraw Hill