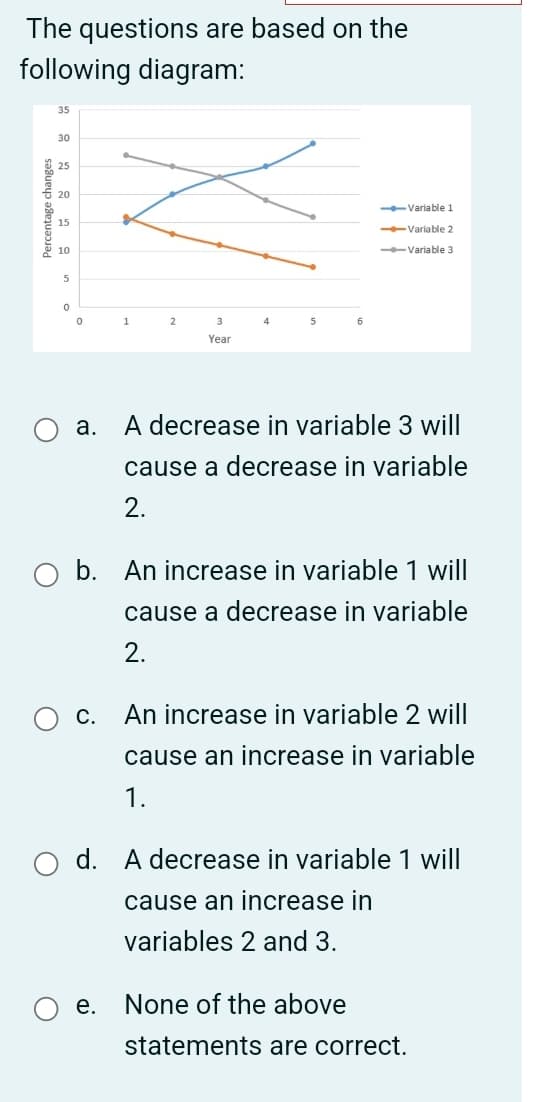
The questions are based on the following diagram: Percentage changes 35 30 25 20 15 10 5 0 0 1 2 3 4 5 6 Year --Variable 1 -Variable 2 --Variable 3 a. A decrease in variable 3 will cause a decrease in variable 2. b. An increase in variable 1 will cause a decrease in variable 2. c. An increase in variable 2 will cause an increase in variable 1. d. A decrease in variable 1 will cause an increase in variables 2 and 3. e. None of the above statements are correct.
Q: The Anderson family lives in the Arizona wilderness. Their property is at risk for being destroyed…
A: The objective of the question is to calculate the Anderson family's expected loss from fire, their…
Q: Find
A: To comprehensively address the question regarding the short-run equilibrium price of titanium in the…
Q: Third-degree price discrimination is: Charging a different price in a secondary market The least…
A: FEEL FREE TO ASK FOR CLARIFICATIONS
Q: The following table pertains to Pieway, an economy in which the typical consumer's basket consists…
A: The objective of the question is to calculate the inflation rate in Year 2, using Year 1 as the base…
Q: Total utility ______ at a ______ rate with every additional purchase of a good/service. Group of…
A: The question is asking about the behavior of total utility as more of a good or service is consumed.…
Q: Suppose a nation's economy produced the amounts of goods given below, along with their associated…
A: Gross domestic product (GDP) measures the money value of all final goods and services produced in an…
Q: 11. Calculating the price elasticity of supply Kevin is a retired teacher living in Philadelphia who…
A: The price elasticity of supply measures the percentage change in the quantity supplied by the…
Q: Use a diagrammatic analysis and show a monopoly that considers a couple of strategies. One is a…
A: When a company focus to maximize profit, it aims to increase revenue and reduce costs to achieve the…
Q: 1. Assume that a survey of households revealed that the non-institutional population 16 years and…
A: Title: Understanding Labor Market Dynamics: Unemployment Rate, Labor Force Participation Rate, and…
Q: Is it ethical for a government to act in ways that socialize financial risks or losses while…
A: The ethics of such actions can be debated, but many argue that such practices can be considered…
Q: Your bank has the following balance sheet: Assets Liabilities Checkable Reserves $90 million $380…
A: To solve this problem, we need to calculate the new balance sheet of the bank after the $20 million…
Q: What is the total utility at 4 units and the marginal utility when Jenna goes from consuming three…
A: The objective of the question is to calculate the total utility at 4 units and the marginal utility…
Q: Do not use chat gpt. Thank you!
A: Option a is correct: In the case of an externality, the production of the good or service creates…
Q: None
A: Evaluation of Statement (a) MARR=9% Initial investment=200000 Present value of salvage…
Q: 1. Many endogenous growth models feature so called scale effects: per capita growth rises when…
A:
Q: Using the method introduced in the video calculate Net National Product. Show answer choices $6,565…
A: The objective of the question is to calculate the Net National Product (NNP) using the given values.…
Q: None
A: Thus, the firm is producing at the amount where ATC is minimised in a long-run equilibrium for a…
Q: One of the key provisions of the Affordable Care Act was the ensuring coverage for “pre- existing…
A: Nash equilibrium is a fundamental concept in game theory that describes a situation in which every…
Q: 2. Deviating from the collusive outcome Stargell and Schmidt are brewing companies that operate in a…
A: Detailed explanation: Here's a breakdown of how we can find these values:Profit-maximizing price and…
Q: Suppose Dr. Splendor is the only instructor of Magical Economics employed by the College of…
A: In economic terms, contractual wages entail mutually agreed-upon terms between employers and workers…
Q: Match the firm with a description of its market power. Drag and drop options on the right-hand side…
A: Here is the matching of firms with descriptions of their market power, along with explanations:Con…
Q: Graphing Question The graph shows the aggregate demand and short-run aggregate supply curves for an…
A: Aggregate Demand (AD): It represents the total demand(DD) for services and items within an economy…
Q: (a) Draw or compute the PPFs of Home and Foreign. (b) Derive the autarky equilibrium in Home,…
A:
Q: Suppose that X is an inferior good. A. Show using well labeled diagrams how you would derive the…
A: The question delves into basic principles in microeconomic theory, with a focus on customer behavior…
Q: Consider an economy with no population growth and no technological progress. The level of the labor…
A: The objective of the question is to understand the relationship between investment, depreciation,…
Q: The price of a car you want is $36,000 today. Its price is expected to increase by $1000 each year.…
A: Future Price = Current Price + (Price Increase per Year * Number of Years)Future Price = $36,000 +…
Q: e. Is the price elasticity of demand between $110 and $130 elastic, unit elastic, or inelastic? f.…
A: Price elasticity of demand is a concept in economics that measures how responsive consumers are to a…
Q: Consider a Robinson Crusoe Economy. There are two commodities in the economy: one is labor L and the…
A: An economic theory known as a Robinson Crusoe economy is used to examine how a basic, solitary…
Q: Affordability = R74 per week \table[[,Proteas (R10),Roses (R6),Lavender…
A: Firstly let's complete the following table:All the formulas and explanation is there in the table.…
Q: The U.S. imports lumber among other goods from Canada. The lumber has been the topic of political…
A: Given,
Q: The following graph plots the planned expenditure line (PE) for an economy in which current…
A: Given, the full employment income is $650 billion and the current level of equilibrium income is…
Q: How does the Time Value of Money help people plan for retirement?
A: The Time Value of Money (TVM) plays a critical role in retirement planning by helping people…
Q: The import duty is a 5% tariff on imported motorcycles. You are given the information shown in the…
A: Tariffs play a multifaceted and important role in international trade, financial governance, and…
Q: Assume that the per-worker production function is yt =2kt 0.3. The saving, depreciation and…
A: The per-worker production function gauges the output relative to labor input in an economy,…
Q: Suppose there is a simple hypothetical economy in which the only industry is cloud computing. In the…
A: Productivity is the ratio of amount of output produced and amount of a input used in that…
Q: 1) If a county becomes less likely to default on its bonds, what happens to that country’s interest…
A: Interest rate:The interest rate is the fee of borrowing cash or the return on an investment…
Q: (Fixed Income Securities) A mortgagor borrows £175,000 to purchase an apartment. She will repay…
A: The above answer can be explained as under - Loan amount = $ 175,000Rate of return per month = 4%/12…
Q: Introduce the concept of the yield curve and its relevance in economic activities inthe Caribbean.
A: Relevance in the Caribbean:The yield curve plays a crucial role in various economic activities in…
Q: 5. Personal Income The following table shows the average annual income in the United States,…
A: Step 1:Create a table like this Step 2:Solve using the formulas involved a) Regression equationFrom…
Q: If the local pizzeria raises the price of a medium pizza from $6 to $10 and quantity demanded falls…
A: The price elasticity is calculated as the percentage change in quantity demanded divided by the…
Q: Prove the following result in the derivation of the asymptotic optimality of the bid-price control…
A:
Q: Which of the following factors will affect the slope of the aggregate demand curve? OA. I C. * OE.…
A: Aggregate demand in the economy represents the total goods and services produced in the economy in a…
Q: Assume the consumption function is C = 200+ (0.8) YD and the income tax rate is t = 0.25. What will…
A: Budget surplus: A budget surplus is simply having more income than expenses during a specific period…
Q: None
A: The problem is assigning the sustainable strategy of store 2 to the grocery stores with two stores…
Q: The city of Amsterdam introduced 30 days limit Sydney has 180 days limit The [Select] on short-term…
A: Under Sydney's current policy, short-term rental platforms are allowed to operate for up to 180 days…
Q: Suppose output per worker in the US is four times (4.0) output per worker in China. Suppose capital…
A: TFP considers the efficiency with which capital and labor are used to produce output. Given:Y as the…
Q: Detailed solution please and asap
A: The demands are directly proportional to the income and inversely proportional to the aggregate…
Q: Refer to the following diagram: Aggregate consumption (C) 60 60 130 200 270 1 45° 0 100 200 300…
A: illustrate the relationship between individual and total consumption and individual and total gross…
Q: Use the photo at exercise 14 to solve the problem below With the Firm Y response function…
A: The game of Stackelberg, two players with the leading and trailing firms function in the market,…
Q: Ivanhoe Company has the following information available for September 2022. Unit selling price of…
A: Let me state the given data, Unit selling price = $ 540Unit variable cost= $ 378Total fixed cost= $…
Step by step
Solved in 2 steps
- Q5. Make a hypothetical data table and try to make interrelationships between AC, MC and AVC for ten observations. Keep in mind the trend of certain variables. Support Your answer with the help of correct graphs and their respective interpretations like Q TFC TVC TC ATC AVC AFC MC 1 2 3 4 And So onCome up with two variables that, in your view, are related, indicate the name of these variables as well as why these variables are related; determine which variable is the dependent variable and which one is the independent variable. Draw a line graph by hand, labeling the vertical and horizontal axis consistent with your choice of variables. The line in the line graph has to represent, what, in your view, is the relationship between the two variables. Describe your graph verbally in your post (no need to upload the graph itself). Note:- • Do not provide handwritten solution. Maintain accuracy and quality in your answer. Take care of plagiarism. • Answer completely. • You will get up vote for sure.The following graph contains four lines (A, B, C and D), each of which has a slope that is either positive, negative, zero, or infinite. Y-axisX-axisBDCA For each of the following scenarios, indicate whether the relationship between the two variables is positive or negative, as well as which line on the previous graph has a slope that reflects this type of relationship. Hint: The X-axis and Y-axis on the graph are not labeled intentionally. You need to substitute the variables from each scenario for the horizontal and vertical axis. For example, in the first scenario, X-axis should be labeled “ ice-cream" and Y-axis should be labeled "The temperature". Scenario Relationship Line As the temperature rises, the demand for ice-cream rises. Negative As the temperature rises, the demand for hot cocoa falls. Positive As the temperature falls, the demand for popsicles falls. Negative True or False: Line B has a slope of infinity.…
- Economics explain both figures individually and under seperate heading. mention what is happeninh in both the graphs and why there is shift in the curves. how the curves effect the variables mentioned in x and y axis. give a detailed explaination and step wise.Q2. a. What is the law of demand? Give two examples of how you have observed the law of demand at work in the “real world.” How is the law of demand related to the demand curve?b. What variables influence the demand for a normal good? Explain why a reduction in the price of a normal good does not increase the demand for that good.Q4. What is econometric forecasting? If econometrics forecasting is considered the bestforecasting technique, what usefulness remains over other forecasting techniquesIdentification. Answer the following questions below. QUESTIONS: 1.) What is the statistical technique for finding the best relationship between dependent variable and selected dependent variable or variables? 2.) What is the increase in output that results from an increase in all of a firm’s outputs by some proportions? 3.) What production function are the 3 stages of production applicable? 4.) What stage of production is the increase in output that results from increase in a firm's outputs by some proportion? 5.) In long run production, a change in output necessitates the what?
- Make a qualitative title.(any topics will do and define its dependent and independent variable)In the equation S = 130 – 2T, where S is hot chocolate sales and T is temperature, sales _____ if temperature increases by 10 degrees. A. increase by 20 B. decrease by 20 C. increase by 2 D. decrease by 2(1) Recent measurements have shown a significant deterioration in the quality of the Scottish seaside. Which of the following statements are compatible with this observation? A. The real value of GDP has increasedB. The real value of GDP remains the same C. North Sea oil wells have dried upD. The price of swimming costumes has gone down (2) The impact of Covid-19 on happiness is negative because A. it decreased economic activityB. it coincided with BrexitC. it forced social isolationD. it obliged people to develop new Information Technology skills(i) A is correct(ii) A and B are correct(iii) A and C are correct(iv) All of the above are correct
- The variable shown on the vertical axis is _________ . The units for the variable on the horizontal axis are __________ . There are two ways to view the information presented on the graph. First, the graph tells us the amount a person with a certain income is likely to spend on a car, and second, it tells us the probable income of a person who spent a certain amount on a car. For example, if an individual earned $40,000 last year and purchased a new car, you would expect that person to have paid about _________ for the car. Similarly, if someone just paid $25,000 for a car, you could use this graph to estimate that this person's income was probably around __________ .Graph and label as either direct or indirect the relationships you would expect to find between (a) the number of inches of rainfal per month and the sale of umbrellas, (b) the amount of tuition and the level of enrollment at a university, and (c) the popularity of an entertainer and the price of her concert tickets.3. Rubax, a U.S. manufacturer of athletic shoes, estimates the following linear trend model for shoe sales: Qt = a+bt+c1D1+c2D2+c3D3Where, Qt = sales of athletic shoes in the t-th quartert = 1, 2, . . . . , 28 [2011(I), 2011(II), . . . . , 2017(IV)]D1 = 1 if t is quarter I (winter); 0 otherwiseD2 = 1 if t is quarter II (spring); 0 otherwiseD3 = 1 if t is quarter III (summer); 0 otherwiseThe regression analysis produces the following results: Is there sufficient statistical evidence of an upward trend in shoe sales? explain Do these data indicate a statistically significant seasonal pattern of sales for Rubax shoes? If so, what is the seasonal pattern exhibited by the data? Using the estimated forecast equation, forecast sales of Rubax shoes for 2018(III) and 2019(II).