The rainfall and snowtall levels in inches at a certain city are collected per year and found to be as shown in the table below. Year rainfal: r, snowfall: y 42.2 40.4 51.2 36.4 35.6 17.8 | 24.2 49 21.2 47.8 | 2010 2011 2012 2013 2014 2015 2016 2017 2018 2019 108 101 133 96 89 62 63 140 66 137 Determine the sample variance of the raintall samples. [The answer should be a number rounded to ive decimal places, don't use symbols such os
The rainfall and snowtall levels in inches at a certain city are collected per year and found to be as shown in the table below. Year rainfal: r, snowfall: y 42.2 40.4 51.2 36.4 35.6 17.8 | 24.2 49 21.2 47.8 | 2010 2011 2012 2013 2014 2015 2016 2017 2018 2019 108 101 133 96 89 62 63 140 66 137 Determine the sample variance of the raintall samples. [The answer should be a number rounded to ive decimal places, don't use symbols such os

Glencoe Algebra 1, Student Edition, 9780079039897, 0079039898, 2018
18th Edition
ISBN:9780079039897
Author:Carter
Publisher:Carter
Chapter10: Statistics
Section: Chapter Questions
Problem 23SGR

Related questions
Question
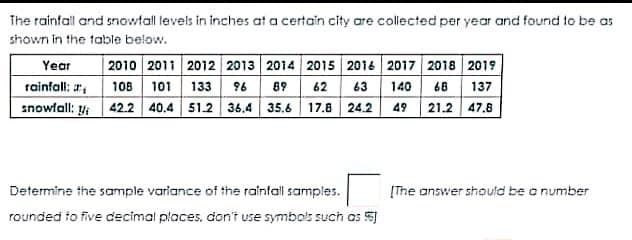
Transcribed Image Text:The rainfall and snowtall levels in inches at a certain city are collected per year and found to be as
shown in the table below.
| 2010 2011 2012 2013 2014 2015 2016 2017 2018 2019
rainfall: ar, 108 101 133 96 89 62 63 140 66 137
snowfall: y 42.2 40.4 51.2 36.4 35.6 17.8 24.2 49 21.2 47.6
Year
Determine the sample variance of the raintall samples.
[The answer should be a number
rounded to five decimal places, don't use symbols such as
Expert Solution
This question has been solved!
Explore an expertly crafted, step-by-step solution for a thorough understanding of key concepts.

Step by step
Solved in 2 steps

Recommended textbooks for you
Glencoe Algebra 1, Student Edition, 9780079039897…
Algebra
ISBN:
9780079039897
Author:
Carter
Publisher:
McGraw Hill
Glencoe Algebra 1, Student Edition, 9780079039897…
Algebra
ISBN:
9780079039897
Author:
Carter
Publisher:
McGraw Hill