The regression equation is ý = D+Dx. (Round to five decimal places as needed.)
Q: The population of a country follows a normal distribution with mean height 180 cm and standard…
A:
Q: Independent random samples were selected from two binomial populations, with sample sizes and the…
A: Given that Independent random samples were selected from two binomial populations, with sample…
Q: 36. A company plans to select a team of five students from Gulf University for a business game…
A: A company plans to select a team of five students from Gulf University for a business game…
Q: A random sample of ?n measurements was selected from a population with unknown mean ?μ and standard…
A: In question, Given that sample size of 21 and sample mean of 21.8 with sample standard deviation of…
Q: Find the test statistic. Round your final answer to two decimal places. Find the p-value. Round to…
A: We have given that Population proportion p = 57% = 0.57 Favourable cases, X = 113 Sample size, n =…
Q: Very few testing procedures are absolutely perfect. This has become particularly apparent with the…
A: Let C be the event that someone has COVID-19 Cc is the event that someone does not have COVID-19 Let…
Q: Convert the trend equation, Y. forward the origin by half a month, given that the trend origin is…
A:
Q: used to enhance the growth r a specific period of time. The sured in centimeters, were recon
A: By applying the ANOVA test for a single factor,
Q: The number of books sold weekly for 6 Weeks by a book store 69 65 66 71 68 73 Class Frequency 61-65…
A: Grouped mean =68.833
Q: good thể student's GPA at graduation? To investigate this question, thirty students were randomly…
A: There are two dependent samples which are Freshman GPA and Graduation GPA. We have to do regression…
Q: Express the confidence interval (0.058,0.154) in the form of p-E<p<p+E. .. <p< (Type integers or…
A: We have given that Confidence interval is (0.058, 0.154)
Q: A factory produces bars of chocolate that follow a Normal Distribution with a mean weight of 60g and…
A:
Q: A. What is the value of the test statistic for a test with a null hypothesis that mu = 83, Xbar =…
A: Given (A) mu = 83, Xbar = 85, the sample standard deviation = 2 and n = 49 (B) mu = 98.6, Xbar =…
Q: An adult rabbit's average length is 30cm, with a standard deviation of 4cm. What is the probability…
A: Given data is Mean(μ)=30 cmstandard deviation(σ)=4 cm
Q: True or False? A clinical trial is conducted to compare an experimental medication to placebo to…
A: A clinical trial of 100 participants is conducted to compare placebo and experimental medication.…
Q: The mass of packages from a particular machine are normally distributed with a mean of 100g and…
A: Given that ; μ = 100 g ?2 = 16 g By using standard normal distribution we solve this problem
Q: You may need to use the appropriate appendix table or technology to answer this question. Sparr…
A:
Q: A normal random variable x has variance equal to 4. Find the mean of the distribution if the…
A: Given,standard deviation(σ)=2
Q: Jsing all 1991 birth records in the computerized national birth certificate registry compiled by the…
A: Given that. X~N( μ , ?^2 ) μ=3432 , ?=482 Z-score =( x - μ )/? NOTE:- According to…
Q: What are the null and alternative hypotheses? The test statistic, t, is The P-value is…
A:
Q: Using multiple linear regression, estimate the values of a, b, and c in the given regression model.…
A: Given information: The data represents the values of the variables X and Y.
Q: Calculate the 1. Population and sample skewness, add interpretation 2. Exact and excess sample…
A: Given data: Class boundaries Frequency 6.5 - 12.5 3 12.5 - 18.5 6 18.5 - 24.5 5 24.5 -…
Q: (a) Compute four-week and five-week moving averages for the time series. 4-Week Moving Average…
A:
Q: What was the mean and standard deviation of the sample
A: A sample of 16 was used to find that the 95% interval estimate for μ was (38.2405725, 42.9394275).
Q: Using z-scores, a population with u = 37 and o = 6 is standardized so that the new mean is u = 50…
A: Given
Q: latch the linear correlation coefficient to the scatter diagram. r= - 0.787 hoose the correct graph…
A: Given, Correlation coefficient is r=-0.787 Match the scatter diagram.
Q: We use the Durbin-Watson d test to determine if there exists serial correlation problem. Which of…
A: Given information: The information about Durbin – Watson test statistic is given.
Q: Consider the following actual demand and forecast data for ARX AG a national distributor of…
A:
Q: X 1 2 4 y 3.6 5.2 6.8 8.8
A: *Answer:
Q: Consider a contingency table of observed frequencies with five rows and four columns. a) How many…
A:
Q: A laundry detergent company wants to determine if a new formula of detergent, A, cleans better than…
A: Obtain the 90% confidence interval for the difference in proportions of clothes that receive a…
Q: maximum and minimum amounts spent per week for the middle 50% of one-person
A: here given, mean = $62 per week on groceries standard deviation = $10
Q: From the data given in the illustration 11 above compute the Chain base Inder numbers.
A:
Q: Obtain the straight line trend equation and tabulate against each year trend and short term…
A:
Q: 10 Some fruit are sold whose weights follow a normal distribution such that X~N(80, 15) If the…
A:
Q: The additional growth of plants in one week are recorded for 11 plants with a sample standard…
A:
Q: A large supermarket carries four qualities of ground beef. Customers are believed to purchase these…
A:
Q: chapter 8 question 11 suppose a simple random sample size of size n= 15 is obtained from a…
A: Let X be the random variable from normal distribution with mean (u) = 61, standard deviation (σ) =…
Q: A population has mean 75 and standard deviation 12. (a) Random samples of size 121 are taken. Find…
A: Given that Population mean μ =75 Population standard deviation =12
Q: The lengths of a professor's classes has a continuous uniform distribution between 49.29 min and…
A: Given that X~Uniform(49.29 , 55.55) Find P57
Q: QUESTION 6 Identify the following as Attribute or Variable data. (A or V) Percent absenteeism Number…
A:
Q: 66% of Americans support death penalty (Gallup, 2004). Seven people are randomly selected. Let the…
A: Let X be the random variable from binomial distribution with probability (p) = 66% = 0.66 and sample…
Q: (a) Which of the following must be true about Lashonda's and Dan's sales? O The value of Dan's sales…
A: here given , A national chain of department stores ranks its 900,000 salespeople by the monetary…
Q: The number of x people entering the intensive care unit (ICU) at a particular hospital on any given…
A:
Q: IIlustration 23,8. After the chart was set up the process was observed to be well under control for…
A:
Q: Solve the following problems: ( Ungrouped Data) The following data are the numbers of deaths of…
A: Given data is3, 4, 5, 5, 6, 6, 7, 8, 9, 9, 10, 11, 11, 11, 12, 14, 15, 15,17, 18sample size(n)=20
Q: Some fruit are sold whose weights follow a normal distribution such that X~N(80, 15) If the lightest…
A: From the provided information, Mean (µ) = 80 Standard deviation (σ) = 15 X~N (80, 15) Here X be a…
Q: Lee wants to find a new investment for his portfolio. He is looking for a safe investment that…
A:
Q: 29 is I. Discrete II. Qualitative II. Quantitative IV. Continuous Choose all the correct…
A: Solution
Q: Obtain the exponential trend equation and the trend values for the following data. 1994 1995 1996…
A:
The best predicted circumference for a diameter 1.2 cm is?
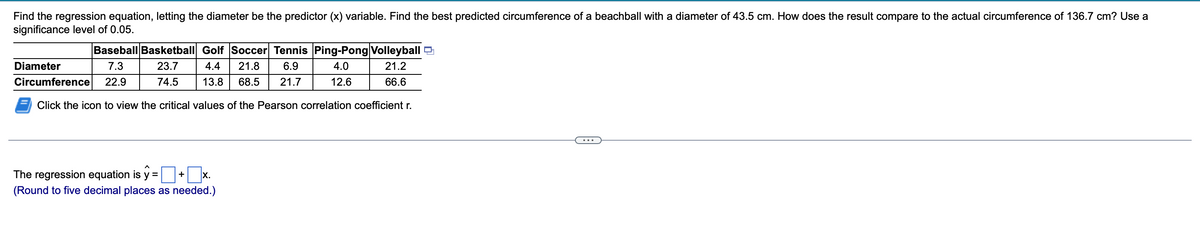
Trending now
This is a popular solution!
Step by step
Solved in 3 steps with 2 images
- Find the regression equation, letting the diameter be the predictor (x) variable. Find the best predicted circumference of a beachball with a diameter of 44.4 cm. How does the result compare to the actual circumference of 139.5 cm? Use a significance level of 0.05. Baseball Basketball Golf Soccer Tennis Ping-Pong Volleyball Diameter 7.3 23.8 4.2 22.3 7.1 4.0 21.2 Circumference 22.9 74.8 13.2 70.1 22.3 12.6 66.6 LOADING... Click the icon to view the critical values of the Pearson correlation coefficient r.Please solve with the computer For the following data, estimate the parameters of the simple linear regression equation(c) Use the regression equation to predict the head circumference of a child who is 24.5 inches tall.
- a. The regression equation is? b.The best-predicted weight for an overhead width of 2.2 cm is?When conducting a linear regression the _____ refers to how much variability in the outcome is explained by the predictor(s). R R2 Slope InterceptUse the linear regression models above to answer this question. Estimate the variable cost per treadmill. Round to the nearest dollar. $ per treadmill produced use ss attached to answer thanks
- a. The regression equation is? b. Given that the systolic blood pressure in the right arm is 80 mm Hg, the best predicted systolic blood pressure is the left arm is?Find the regression equation, letting overhead width be the predictor (x) variable. Find the best predicted weight of a seal if the overhead width measured from a photograph is 2.3 cm. Can the prediction be correct? What is wrong with predicting the weight in this case? Use a significance level of 0.05. Overhead Width (cm) 7.2 8.3 8.8 8.1 9.9 9.8 Weight (kg) 121 195 210 156 250 253Find the regression model for the data given
- Solve manually/ show complete solutions Find the Regression line for the following data:Find the regression equation, letting the first variable be the predictor (x) variable. Using the listed lemon/crash data, where lemon imports are in metric tons and the fatality rates are per 100,000 people, find the best predicted crash fatality rate for a year in which there are 500 metric tons of lemon imports. Is the prediction worthwhile? Lemon Imports 228 260 364 497 514 Crash Fatality Rate 16 15.8 15.6 15.4 14.9The average height of people in Faroe island is 180cm. Suppose you run a regression with no independent variables. What would be the estimated form of your regression?