The regression output was based on a sample of 213 cane toads. How many degrees of freedom does the appropriate t-distribution used to get the p value and the t∗ critical value for confidence intervals have?
The regression output was based on a sample of 213 cane toads. How many degrees of freedom does the appropriate t-distribution used to get the p value and the t∗ critical value for confidence intervals have?

College Algebra
7th Edition
ISBN:9781305115545
Author:James Stewart, Lothar Redlin, Saleem Watson
Publisher:James Stewart, Lothar Redlin, Saleem Watson
Chapter1: Equations And Graphs
Section: Chapter Questions
Problem 10T: Olympic Pole Vault The graph in Figure 7 indicates that in recent years the winning Olympic men’s...

Related questions
Topic Video
Question
From the image:
The regression output was based on a sample of 213 cane toads. How many degrees of freedom does the appropriate t-distribution used to get the p value and the t∗ critical value for confidence intervals have?
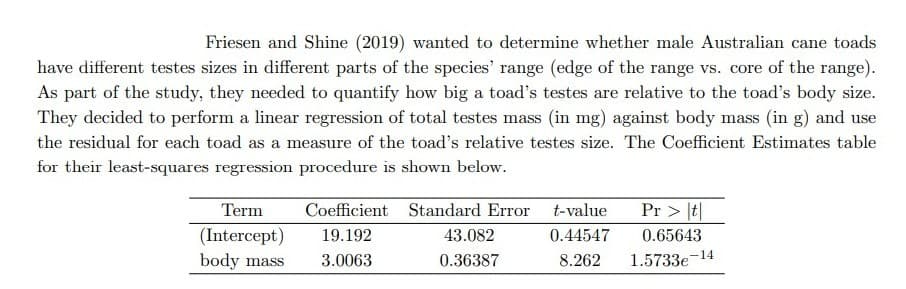
Transcribed Image Text:Friesen and Shine (2019) wanted to determine whether male Australian cane toads
have different testes sizes in different parts of the species' range (edge of the range vs. core of the range).
As part of the study, they needed to quantify how big a toad's testes are relative to the toad's body size.
They decided to perform a linear regression of total testes mass (in mg) against body mass (in g) and use
the residual for each toad as a measure of the toad's relative testes size. The Coefficient Estimates table
for their least-squares regression procedure is shown below.
Term
Coefficient Standard Error
t-value
Pr > |t|
(Intercept)
19.192
43.082
0.44547
0.65643
body mass
3.0063
0.36387
8.262
1.5733e
-14
Expert Solution
This question has been solved!
Explore an expertly crafted, step-by-step solution for a thorough understanding of key concepts.

Step by step
Solved in 2 steps

Knowledge Booster


Learn more about
Need a deep-dive on the concept behind this application? Look no further. Learn more about this topic, statistics and related others by exploring similar questions and additional content below.Recommended textbooks for you
College Algebra
Algebra
ISBN:
9781305115545
Author:
James Stewart, Lothar Redlin, Saleem Watson
Publisher:
Cengage Learning

Linear Algebra: A Modern Introduction
Algebra
ISBN:
9781285463247
Author:
David Poole
Publisher:
Cengage Learning

Algebra and Trigonometry (MindTap Course List)
Algebra
ISBN:
9781305071742
Author:
James Stewart, Lothar Redlin, Saleem Watson
Publisher:
Cengage Learning
College Algebra
Algebra
ISBN:
9781305115545
Author:
James Stewart, Lothar Redlin, Saleem Watson
Publisher:
Cengage Learning
Linear Algebra: A Modern Introduction
Algebra
ISBN:
9781285463247
Author:
David Poole
Publisher:
Cengage Learning
Algebra and Trigonometry (MindTap Course List)
Algebra
ISBN:
9781305071742
Author:
James Stewart, Lothar Redlin, Saleem Watson
Publisher:
Cengage Learning

Trigonometry (MindTap Course List)
Trigonometry
ISBN:
9781305652224
Author:
Charles P. McKeague, Mark D. Turner
Publisher:
Cengage Learning

Glencoe Algebra 1, Student Edition, 9780079039897…
Algebra
ISBN:
9780079039897
Author:
Carter
Publisher:
McGraw Hill

Functions and Change: A Modeling Approach to Coll…
Algebra
ISBN:
9781337111348
Author:
Bruce Crauder, Benny Evans, Alan Noell
Publisher:
Cengage Learning