The relationship between income a and expenditure y was estimated by the following regression equation. 300 +0.9x If a person has income 3500, what is the predicted expenditure? Select one: O a. 3450 O b. 2820 c. 2280 d. 3180
The relationship between income a and expenditure y was estimated by the following regression equation. 300 +0.9x If a person has income 3500, what is the predicted expenditure? Select one: O a. 3450 O b. 2820 c. 2280 d. 3180

Glencoe Algebra 1, Student Edition, 9780079039897, 0079039898, 2018
18th Edition
ISBN:9780079039897
Author:Carter
Publisher:Carter
Chapter4: Equations Of Linear Functions
Section4.6: Regression And Median-fit Lines
Problem 17HP

Related questions
Question
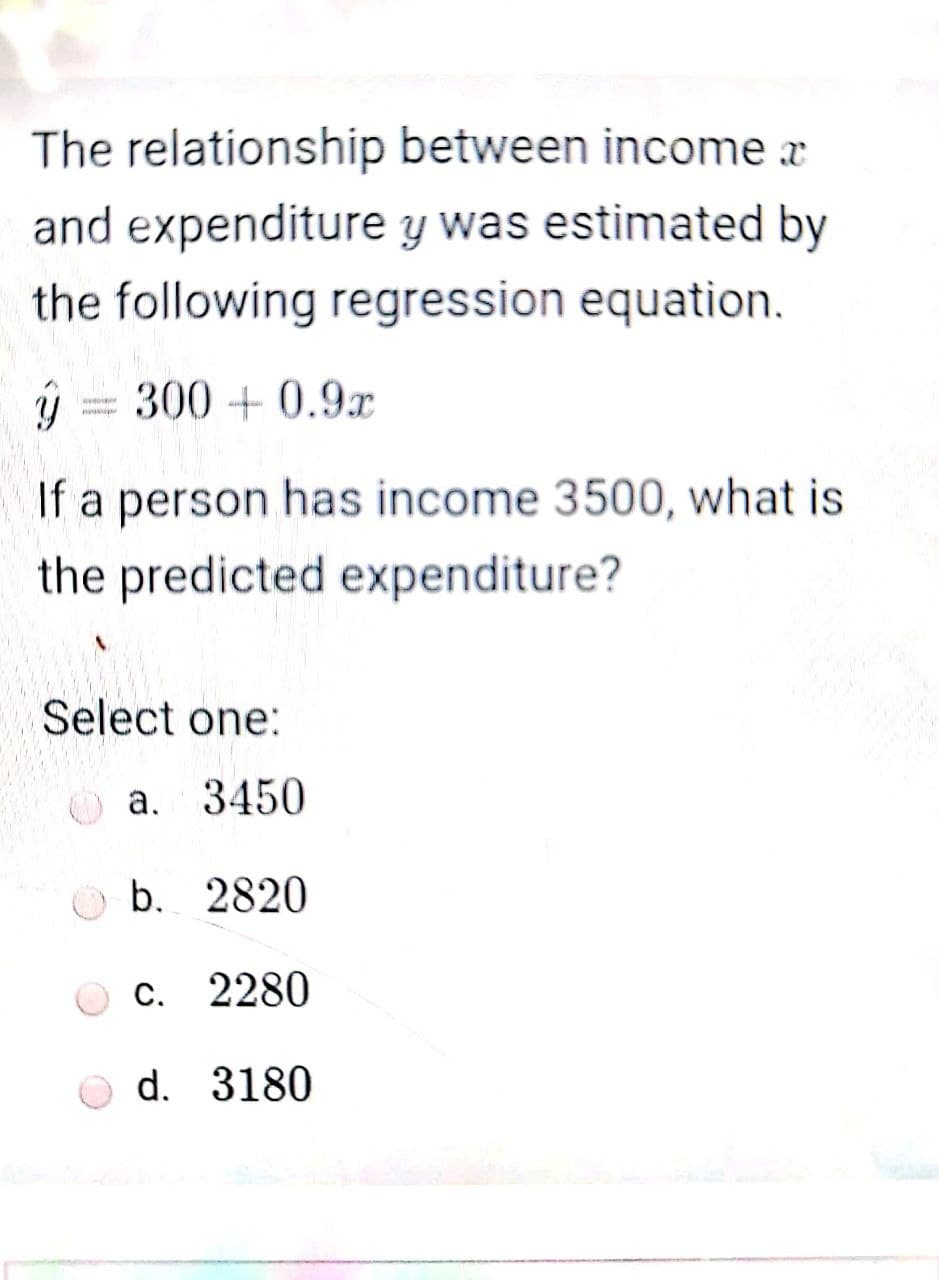
Transcribed Image Text:The relationship between income
and expenditure y was estimated by
the following regression equation.
ý = 300 + 0.9.r
If a person has income 3500, what is
the predicted expenditure?
Select one:
a. 3450
O b. 2820
c. 2280
d. 3180
Expert Solution
This question has been solved!
Explore an expertly crafted, step-by-step solution for a thorough understanding of key concepts.

Step by step
Solved in 2 steps with 2 images

Recommended textbooks for you
Glencoe Algebra 1, Student Edition, 9780079039897…
Algebra
ISBN:
9780079039897
Author:
Carter
Publisher:
McGraw Hill


Functions and Change: A Modeling Approach to Coll…
Algebra
ISBN:
9781337111348
Author:
Bruce Crauder, Benny Evans, Alan Noell
Publisher:
Cengage Learning
Glencoe Algebra 1, Student Edition, 9780079039897…
Algebra
ISBN:
9780079039897
Author:
Carter
Publisher:
McGraw Hill
Functions and Change: A Modeling Approach to Coll…
Algebra
ISBN:
9781337111348
Author:
Bruce Crauder, Benny Evans, Alan Noell
Publisher:
Cengage Learning

College Algebra
Algebra
ISBN:
9781305115545
Author:
James Stewart, Lothar Redlin, Saleem Watson
Publisher:
Cengage Learning

Algebra and Trigonometry (MindTap Course List)
Algebra
ISBN:
9781305071742
Author:
James Stewart, Lothar Redlin, Saleem Watson
Publisher:
Cengage Learning