The results of a mathematics placement exam at two different campuses of Mercy College follow: Campus Sample size Mean Population Std. Deviation 1 330 33 8. 2 310 31 7 What is the computed value of the test statistic? 9.3 2.6 3.4 1.9 OOO
The results of a mathematics placement exam at two different campuses of Mercy College follow: Campus Sample size Mean Population Std. Deviation 1 330 33 8. 2 310 31 7 What is the computed value of the test statistic? 9.3 2.6 3.4 1.9 OOO

Glencoe Algebra 1, Student Edition, 9780079039897, 0079039898, 2018
18th Edition
ISBN:9780079039897
Author:Carter
Publisher:Carter
Chapter10: Statistics
Section10.5: Comparing Sets Of Data
Problem 1GP

Related questions
Question
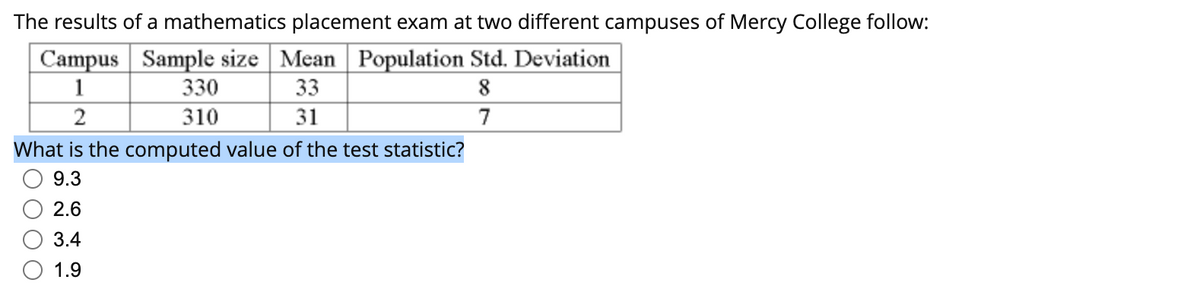
Transcribed Image Text:The results of a mathematics placement exam at two different campuses of Mercy College follow:
Campus Sample size Mean Population Std. Deviation
33
1
330
2
310
31
7
What is the computed value of the test statistic?
9.3
2.6
3.4
1.9
Expert Solution
This question has been solved!
Explore an expertly crafted, step-by-step solution for a thorough understanding of key concepts.

This is a popular solution!

Trending now
This is a popular solution!

Step by step
Solved in 2 steps

Recommended textbooks for you
Glencoe Algebra 1, Student Edition, 9780079039897…
Algebra
ISBN:
9780079039897
Author:
Carter
Publisher:
McGraw Hill
Glencoe Algebra 1, Student Edition, 9780079039897…
Algebra
ISBN:
9780079039897
Author:
Carter
Publisher:
McGraw Hill