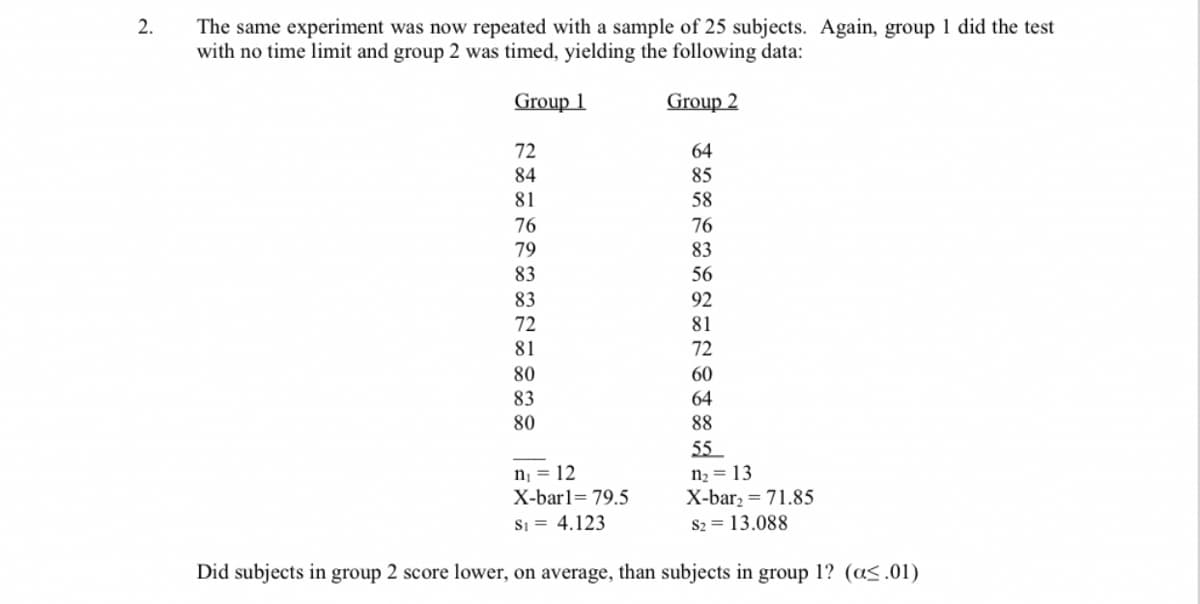
The same experiment was now repeated with a sample of 25 subjects. Again, group 1 did the test with no time limit and group 2 was timed, yielding the following data: Group 1 Group 2 72 84 81 76 79 83 83 72 81 80 83 80 64 85 58 76 83 56 92 81 72 60 64 88 55 n₁ = 12 n₂ = 13 X-bar1= 79.5 Si= 4.123 X-bar₂ = 71.85 $2= 13.088 Did subjects in group 2 score lower, on average, than subjects in group 1? (a<.01)


Q: An analyst wants to compare the 5G service provided by Zain and STC. A sample of five customers…
A: To test the hypothesis that the average customer satisfaction of Zain users is higher than STC by at…
Q: You may need to use the appropriate appendix table or technology to answer this question. In a…
A: The population proportion: Confidence level: Margin of Error:
Q: The College Board reported that SAT scores in the early 2000s were normally distributed with mean…
A: The Z-score for the random variable X equals 816 is obtained below as follows:From the information,…
Q: The lifetime (Y) of a semiconductor laser has a lognormal distribution with a mean of 10 and a…
A: a)Let's denote the parameters of the normal distribution as μ (mean) and σ (standard deviation). In…
Q: Required: a. What are the null and alternate hypot
A: Here the dependent variable is the attention span in seconds.The independent variable is the effect…
Q: Calculate the indicated probabilities, assuming that Z is a continuous random variable that follows…
A: From the provided information,The indicated probabilities are as follow:P (Z < -1.49)P…
Q: Problem #1: IQs are known to be normally distributed with mean 100 and standard deviation 15. In a…
A:
Q: Please no written by hand solutions After a losing season, there is a great uproar to fire the head…
A: The question is about hypothesis testingGiven :Randomly selected college alumni ( n ) = 210No. of…
Q: A simple random sample of size n is drawn from a population that is normally distributed. The sample…
A: The question is about confidence intervalGiven :Mean of the sample ( ) = 105Standard deviation of…
Q: Data on the gasoline tax per gallon (in cents) as of a certain date for the 50 U.S. states and the…
A: The data represents the gasoline tax per gallon for each of the 50 US states and district of…
Q: random sample of 30 tires, (i) (ii) Identify the distribution's mean, standard deviation and…
A: Let X be the random variable that tires lifeline.Given that,Population mean Population standard…
Q: Vegas Repair is a company that specializes in smartphone repair. They want to implement a policy…
A: Step 1:Suppose the population mean time to fix a standard iPhone screen is µ.
Q: The table available below shows the weights (in pounds) for a sample of vacuum cleaners. The weights…
A: Bagged uprightBagless uprightTop canister212025222226231823191927201728192222
Q: During a game of Blackjack, three players are dealt two cards each, and the dealer has two cards. No…
A: The probability shows how likely an event occurs and its value lies between 0 and 1.
Q: Find the standard deviation for the following probability distribution. Round to two decimal places.…
A: From the provided information,The probability distribution table is as follow:X15678P (X =…
Q: Calculate Expected rate of return on portfolio basis of the following companies accorgieg, to is…
A: CompanyExpected ReturnBetaAPPLE12%1.5McDonalds13%1.1RENAULT11%1.3Samsung15%1.9Total investment in…
Q: For a fixed significance level test with a = 0.03, which p-values would lead you to reject the null…
A: Level of significance=α=0.03
Q: Let Z∼N(0,1). Find P(-2<Z<1).
A: From the provided information,Z~N (0, 1)The probability P (-2<Z<1) need to be calculated.
Q: Solve using R Caculator The average hourly wage for manufacturing workers in the United States is…
A: Population mean, Population standard deviation,
Q: The sampling distribution of the statistic (x-μ)/(s/√) is the t distribution only if the sample is…
A:
Q: The average time it takes college freshmen to complete the Mason Basic Reasoning Test is 26 minutes.…
A: Let X denotes the college freshman to complete the Mason Basic Reasoning test with mean 26 minutes…
Q: 5. Charges for Births Data Set 3 "Births" in Appendix B includes total charges for births at four…
A: Data471062359091290837271863255788247477232782197912183271155857
Q: Suppose that a population X has a normal distribution with mean 17 and standard deviation 4.…
A: Mean()=17standard deviation()=4
Q: Use the confidence interval to find the estimated margin of error. Then find the sample mean. A…
A: Given thatA biologist reports a confidence interval of (3.9 , 4.3 ) when estimating the height (cm)…
Q: A researcher who is in charge of an educational study wants subjects to perform some special skill.…
A: Standard normal distribution:A normal distribution with a mean of zero and a standard deviation of…
Q: Step 1 of 2: Find the value of the test statistic to test for a difference in the median test scores…
A: Program AProgram B71896777817377988666101769281
Q: Suppose Canadian home-owners owe an average of $194,000 on their mortgages. Assume that mortgage…
A:
Q: Express the confidence interval 0.251 ± 0.043 in the form of p-E<p<p+E. <p<(Type integers or…
A: Suppose p is the true population proportion.
Q: Cost per serving (in cents) for six high-fiber cereals rated very good and for nine high-fiber…
A: Cereals rated very good : { 44,47,63,43,17,76 } N = 6Cereals rated good : {…
Q: In a random sample of 25 people, the mean commute time to work was 31.9 minutes and the standard…
A:
Q: Find the sample proportion of teenagers 13 to 17 years of age who use social media The sample…
A: It is given that Favourable cases(use social media), X = 158Sample size, n = 200
Q: ose the weights of 3-month-old babies are normally distributed—baby boys with a mean of 14.3 pounds…
A:
Q: A box in a supply room contains 21 compact fluorescent lightbulbs, of which 7 are rated 13-watt, 8…
A: The total number bulbsThe number of 13-watt bulbsThe number of 18-watt bulbsThe number of 23-watt…
Q: Average sales for an online textbook distributor were $68.65 per customer per purchase. Assume the…
A:
Q: A business student has $3,500 available from a summer job and has identified three potential stocks…
A:
Q: Find the margin of error for the given values of c, o, and n. c=0.90, o=2.8, n = 100 E= Click the…
A: Confidence level Population standard deviation Sample size
Q: Find both the arithmetic growth rate and the geometric growth rate of the dividends for Mac and Jack…
A: To find the arithmetic growth rate of the dividends for Mac and Jack Pizza, we can use the following…
Q: In manufacturing integrated circuits, the yield of the manufacturing process is the percentage of…
A: The probability that an integrated circuit manufactured by the Ace Electronics Company will be…
Q: Find the critical value to for the confidence level c = 0.95 and sample size n = 7. Click the icon…
A: The question is about t distributionGiven :Level of confidence ( c ) = 0.95Sample size ( n ) = 7To…
Q: The table available below shows the weights (in pounds) for a sample of vacuum cleaners. The weights…
A: Null hypothesis:The null hypothesis defined usually that whether there is no difference in the test…
Q: In a bag of 365 chocolate candies, 38 of them are brown. The candy company claims that 13% of its…
A: Normal Distribution:the Normal Distribution, also called the Gaussian Distribution, is the most…
Q: A social service agency plans to conduct a survey to determine the mean income of its clients. The…
A: Population standard deviation, Margin of error, No, we do not need an estimate of the current mean…
Q: Question 22 The graph illustrates a normal distribution for the prices paid for a particular model…
A: For the distribution of the price (in ) paid for the HD television, it is defined that:The mean, The…
Q: 2. In the past, students in a particular course have achieved a mean Xmas exam score of 72.6, with a…
A: 2)The mean Xmas exam score, The sample standard deviation, The sample size in the first section exam…
Q: Problem 11-18 (modified). NASA scientists obtained the following data from airborne radiometer scans…
A: Following is the formula for 95% confidence interval of the population mean…
Q: You receive a brochure from a large university. The brochure indicates that the mean class size for…
A: 32,31,31,33,30,38,24,25,32,30,27,35,33,28,26,33,30,24significance level()=0.05
Q: Use the accompanying data table to (a) draw a normal probability plot, (b) determine the linear…
A: The question is about correlationGiven :To find :b ) Linear correlation c ) Critical value for…
Q: 1. In a psychology experiment, 24 subjects were randomly assigned to either a control or an…
A: Hi! Thank you for the question, As per the honor code, we are allowed to answer one question at a…
Q: The following set of data is from a sample of n = 7. 3 11 8 12 11 6 a. Compute the mean, median, and…
A: Sample size Data values: 3, 11, 8, 1, 2, 11, 6.
Q: A researcher at the Sloan-Kettering Cancer Research Center was once criticized or falsifying data.…
A:

Step by step
Solved in 3 steps with 12 images

- A researcher has developed a new drug designed to reduce blood pressure. In an experiment, 22 subjects were assigned randomly to the treatment group and received the new experimental drug. The other 24 subjects were assigned to the control group and received a standard, well-known treatment. After a suitable period, the reduction in blood pressure for each subject was recorded. A summary of these data is: nn x¯x¯ ss Treatment group (new drug) 22 23.48 8.01 Control group (old drug) 24 18.52 7.15 Without using software, how would you estimate the number of degrees of freedom for this problem? Select one: use the larger value, 23, chosen from the two options 21 and 23 use the smaller value, 22, chosen from the two options 22 and 24 use the larger value, 24, chosen from the two options 22 and 24 use the smaller value, 21, chosen from the two options 21 and 23If X1 and X2 constitute a random sample of size n = 2from an exponential population, find the efficiency of 2Y1relative to X, where Y1 is the first order statistic and 2Y1and X are both unbiased estimators of the parameterQUESTION 12 Historically, the proportion of people who trade in their old car to a car dealer when purchasing a new car is 48%. Over the previous 6 months, in a sample of 115 new-car buyers, 46 have traded in their old car. To determine (at the 10% level of significance) whether the proportion of new-car buyers that trade in their old car has statistically significantly decreased, what can you conclude concerning the null hypothesis? Reject the null hypothesis Fail to reject the null hypothesis
- A local church is interested in determining how length of residence in the present community relates to church attendance. Using a random sample of 15 individuals, they gathered data on how many times in the previous 5 weeks each individual attended church services. The data are provided below. Length of residence in the community Less than 2 years 2-5 years More than 5 years 0 0 1 1 2 3 3 3 3 4 4 4 4 5 4 Using the 5-step model, determine whether and how church attendance is related to length of residence in the community. Use 5% and 1% levels of statistical significance. What are the assumptions for this problem?Which of these experiments will have the LEAST power? Group of answer choices Experiment with sample size of n = 20 and a large effect size (Cohen’s d = 0.45) Experiment with sample size of n = 20 and a small effect size (Cohen’s d = 0.05) Experiment with sample size of n = 40 and a large effect size (Cohen’s d = 0.45) Experiment with sample size of n = 40 and a small effect size (Cohen’s d = 0.05)QUESTION 12 Historically, the proportion of people who trade in their old car to a car dealer when purchasing a new car is 48%. Over the previous 6 months, in a sample of 115 new-car buyers, 46 have traded in their old car. To determine (at the 10% level of significance) whether the proportion of new-car buyers that trade in their old car has statistically significantly decreased, what can you conclude concerning the null hypothesis?
- Question #4. US Universities found that 72% of people are concerned about the possibility that their personal records could be stolen over the Internet. If a random sample of 300 college students at a Midwestern university were taken and 228 of them were concerned about the possibility that their personal records could be stolen over the Internet, could you conclude at the 0.025 level of significance that a higher proportion of the university's college students are concerned about Internet theft than the public at large? Report the p-value for this test. Z0.025 = 1.96A paper investigated the driving behavior of teenagers by observing their vehicles as they left a high school parking lot and then again at a site approximately 1 2 mile from the school. Assume that it is reasonable to regard the teen drivers in this study as representative of the population of teen drivers. Amount by Which Speed Limit Was Exceeded MaleDriver FemaleDriver 1.3 -0.1 1.3 0.4 0.9 1.1 2.1 0.7 0.7 1.1 1.3 1.2 3 0.1 1.3 0.9 0.6 0.5 2.1 0.5 (a) Use a .01 level of significance for any hypothesis tests. Data consistent with summary quantities appearing in the paper are given in the table. The measurements represent the difference between the observed vehicle speed and the posted speed limit (in miles per hour) for a sample of male teenage drivers and a sample of female teenage drivers. (Use μmales − μfemales.Round your test statistic to two decimal places. Round your degrees of freedom down to the nearest whole number. Round your p-value to…The article “Withdrawal Strength of Threaded Nails” (D. Rammer, S. Winistorfer, and D. Bender, Journal of Structural Engineering 2001:442–449) describes an experiment comparing the ultimate withdrawal strengths (in N/mm) for several types of nails. For an annularly threaded nail with shank diameter 3.76 mm driven into spruce-pine-fir lumber, the ultimate withdrawal strength was modeled as lognormal with μ = 3.82 and σ = 0.219. For a helically threaded nail under the same conditions, the strength was modeled as lognormal with μ = 3.47 and σ = 0.272. a) What is the mean withdrawal strength for annularly threaded nails? b) What is the mean withdrawal strength for helically threaded nails? c) For which type of nail is it more probable that the withdrawal strength will be greater than 50 N/mm? d) What is the probability that a helically threaded nail will have a greater withdrawal strength than the median for annularly threaded nails? e) An experiment is performed in which withdrawal…
- A paper investigated the driving behavior of teenagers by observing their vehicles as they left a high school parking lot and then again at a site approximately 1 2 mile from the school. Assume that it is reasonable to regard the teen drivers in this study as representative of the population of teen drivers. Amount by Which Speed Limit Was Exceeded MaleDriver FemaleDriver 1.2 -0.1 1.4 0.4 0.9 1.1 2.1 0.7 0.7 1.1 1.3 1.2 3 0.1 1.3 0.9 0.6 0.5 2.1 0.5 (a) Use a .01 level of significance for any hypothesis tests. Data consistent with summary quantities appearing in the paper are given in the table. The measurements represent the difference between the observed vehicle speed and the posted speed limit (in miles per hour) for a sample of male teenage drivers and a sample of female teenage drivers. (Use μmales − μfemales.Round your test statistic to two decimal places. Round your degrees of freedom down to the nearest whole number. Round your p-value to…In Table 11.2 the estimated coefficient on black is 0.084 in column (1),0.688 in column (2), and 0.389 in column (3). In spite of these large differences, all three models yield similar estimates of the marginal effect of race on the probability of mortgage denial. How can this be?The following data are from a random sample of 10 students who participated in a study undertaken to investigate the effect of sleep time (measured in average number of hours of sleep per night) on GPA (grade point average, measured on a 4-point scale). Student Sleep time GPA 1 7 3.28 2 9 3.16 3 8 3.75 4 6 2.50 5 4 2.45 6 8 2.91 7 7 3.53 8 6 3.02 9 3 2.30 10 8 3.48 a. Find the equation between GPA (y) as function of sleep time (x). b. What is the estimated GPA of a student who averages 5 hours of sleep per night? c. What is the coefficient of determination? *(no use EXCEL)