The security of two software systems are compared. A total of 225 security tests (fake attacks) were carried out on System 1 and, in 100 of them, the system was unaffected. On the other hand, 175 tests were conducted on System 2 and, in 40 of them, the system remained unaffected. Help test engineers decide whther there is a meaningful difference between the security levels of two systems (measured by the proportion of unsuccessful attacks) by building a confidence interval. Click here to view page 1 of the standard normal distribution table, Click here to view page 2 of the standard normal distribution table With 99% confidence, the engineers can conclude that the difference among security levels p, - P2 will be between and (Round to three decimal places including any zeros.) Obviously, the interval V This means, the case p, - p2 = 0 excluded from 99% of all possible values p, - p2 can take. Pi - P2 P2 The security of two software systems are compared. A total of 225 security tests (fake attacks) were carried out on System 1 and, in 100 of them, the system was unaffected. On the other hand, 175 tests were conducted on System 2 and, in 40 of them, the system remained unaffected. Help test engineers decide whther there is a meaningful difference between the security levels of two systems (measured by the proportion of unsuccessful attacks) by building a confidence interval. Click here to view.page 1 of the standard normal distribution table. Click here to view page 2 of the standard normal distribution table. With 99% confidence, the engineers can conclude that the difference among security levels p, -P2 will be between and (Round to three decimal places including any zeros.) Obviously, the interval This means, the case p, -P2 =0 excluded from 99% of all possible values p, - P2 can take. does not contain contains The security of two software systems are compared. A total of 225 security tests (fake attacks) were carried out on System 1 and, in 100 of them, the system was unaffected. On the other hand, 175 tests were conducted on System 2 and, in 40 of them, the system remained unaffected. Help test engineers decide whther there is a meaningful difference between the security levels of two systems (measured by the proportion of unsuccessful attacks) by building a confidence interval. Click here to view page 1 of the standard normal distribution table. Click here to view page 2 of the standard normal distribution table. With 99% confidence, the engineers can conclude that the difference among security levels p, - p2 will be between and (Round to three decimal places including any zeros.) Obviously, the interval V This means, the case p, - P2 =0 V excluded from 99% of all possible values p, - P2 can take. is not is
The security of two software systems are compared. A total of 225 security tests (fake attacks) were carried out on System 1 and, in 100 of them, the system was unaffected. On the other hand, 175 tests were conducted on System 2 and, in 40 of them, the system remained unaffected. Help test engineers decide whther there is a meaningful difference between the security levels of two systems (measured by the proportion of unsuccessful attacks) by building a confidence interval. Click here to view page 1 of the standard normal distribution table, Click here to view page 2 of the standard normal distribution table With 99% confidence, the engineers can conclude that the difference among security levels p, - P2 will be between and (Round to three decimal places including any zeros.) Obviously, the interval V This means, the case p, - p2 = 0 excluded from 99% of all possible values p, - p2 can take. Pi - P2 P2 The security of two software systems are compared. A total of 225 security tests (fake attacks) were carried out on System 1 and, in 100 of them, the system was unaffected. On the other hand, 175 tests were conducted on System 2 and, in 40 of them, the system remained unaffected. Help test engineers decide whther there is a meaningful difference between the security levels of two systems (measured by the proportion of unsuccessful attacks) by building a confidence interval. Click here to view.page 1 of the standard normal distribution table. Click here to view page 2 of the standard normal distribution table. With 99% confidence, the engineers can conclude that the difference among security levels p, -P2 will be between and (Round to three decimal places including any zeros.) Obviously, the interval This means, the case p, -P2 =0 excluded from 99% of all possible values p, - P2 can take. does not contain contains The security of two software systems are compared. A total of 225 security tests (fake attacks) were carried out on System 1 and, in 100 of them, the system was unaffected. On the other hand, 175 tests were conducted on System 2 and, in 40 of them, the system remained unaffected. Help test engineers decide whther there is a meaningful difference between the security levels of two systems (measured by the proportion of unsuccessful attacks) by building a confidence interval. Click here to view page 1 of the standard normal distribution table. Click here to view page 2 of the standard normal distribution table. With 99% confidence, the engineers can conclude that the difference among security levels p, - p2 will be between and (Round to three decimal places including any zeros.) Obviously, the interval V This means, the case p, - P2 =0 V excluded from 99% of all possible values p, - P2 can take. is not is

Glencoe Algebra 1, Student Edition, 9780079039897, 0079039898, 2018
18th Edition
ISBN:9780079039897
Author:Carter
Publisher:Carter
Chapter10: Statistics
Section10.6: Summarizing Categorical Data
Problem 28PPS

Related questions

Topic Video
Question
100%
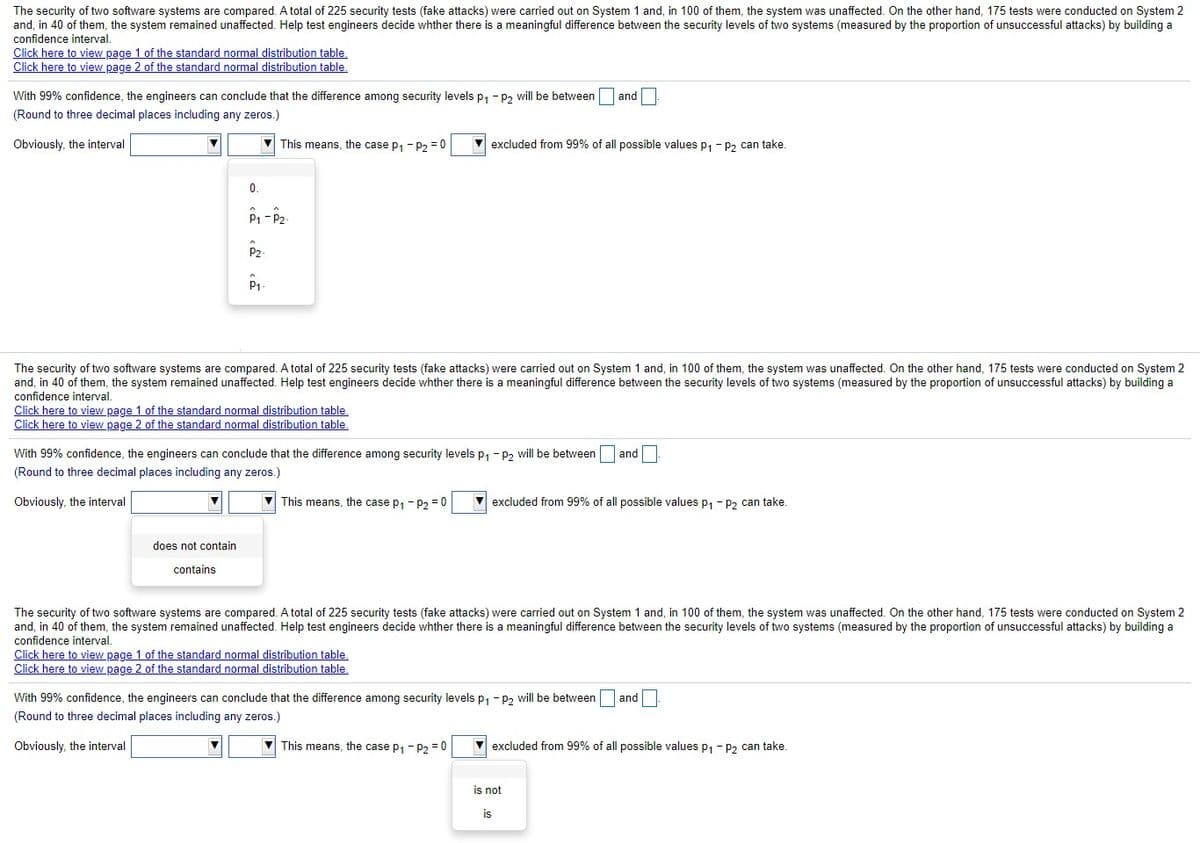
Transcribed Image Text:The security of two software systems are compared. A total of 225 security tests (fake attacks) were carried out on System 1 and, in 100 of them, the system was unaffected. On the other hand, 175 tests were conducted on System 2
and, in 40 of them, the system remained unaffected. Help test engineers decide whther there is a meaningful difference between the security levels of two systems (measured by the proportion of unsuccessful attacks) by building a
confidence interval.
Click here to view page 1 of the standard normal distribution table.
Click here to view page 2 of the standard normal distribution table.
With 99% confidence, the engineers can conclude that the difference among security levels p, - p2 will be between and
(Round to three decimal places including any zeros.)
Obviously, the interval
V This means, the case p, - P2 = 0
excluded from 99% of all possible values p, - p2 can take.
0.
P1 - P2-
P2-
P1
The security of two software systems are compared. A total of 225 security tests (fake attacks) were carried out on System 1 and, in 100 of them, the system was unaffected. On the other hand, 175 tests were conducted on System 2
and, in 40 of them, the system remained unaffected. Help test engineers decide whther there is a meaningful difference between the security levels of two systems (measured by the proportion of unsuccessful attacks) by building a
confidence interval.
Click here to view page 1 of the standard normal distribution table,
Click here to view page 2 of the standard normal distribution table,
With 99% confidence, the engineers can conclude that the difference among security levels p, - P2 will be between
and
(Round to three decimal places including any zeros.)
Obviously, the interval
V This means, the case p, - p2 = 0
V excluded from 99% of all possible values p1- P2 can take.
does not contain
contains
The security of two software systems are compared. A total of 225 security tests (fake attacks) were carried out on System 1 and, in 100 of them, the system was unaffected. On the other hand, 175 tests were conducted on System 2
and, in 40 of them, the system remained unaffected. Help test engineers decide whther there is a meaningful difference between the security levels of two systems (measured by the proportion of unsuccessful attacks) by building a
confidence interval.
Click here to view page 1 of the standard normal distribution table.
Click here to view page 2 of the standard normal distribution table.
With 99% confidence, the engineers can conclude that the difference among security levels p, - p2 will be between
and
(Round to three decimal places including any zeros.)
Obviously, the interval
This means, the case p1- P2 =0
excluded from 99% of all possible values p, - P2 can take.
is not
is
Expert Solution
This question has been solved!
Explore an expertly crafted, step-by-step solution for a thorough understanding of key concepts.

Step by step
Solved in 2 steps with 2 images

Knowledge Booster


Learn more about
Need a deep-dive on the concept behind this application? Look no further. Learn more about this topic, statistics and related others by exploring similar questions and additional content below.Recommended textbooks for you
Glencoe Algebra 1, Student Edition, 9780079039897…
Algebra
ISBN:
9780079039897
Author:
Carter
Publisher:
McGraw Hill

Glencoe Algebra 1, Student Edition, 9780079039897…
Algebra
ISBN:
9780079039897
Author:
Carter
Publisher:
McGraw Hill