The shape of the distribution of the house prices shown in this histogram is! Distribution of House Prices for a Random Sample of 95 Houses Relative Frequency 0.35 0.3 0.25 0.2 0.15 0.1 0.05 2000 1500 Price (in thousands) 500 1000 2500 3000 3500 O a. Uniform O b. Right-skewed O c. Left-skewed O d. Symmetric
The shape of the distribution of the house prices shown in this histogram is! Distribution of House Prices for a Random Sample of 95 Houses Relative Frequency 0.35 0.3 0.25 0.2 0.15 0.1 0.05 2000 1500 Price (in thousands) 500 1000 2500 3000 3500 O a. Uniform O b. Right-skewed O c. Left-skewed O d. Symmetric

Glencoe Algebra 1, Student Edition, 9780079039897, 0079039898, 2018
18th Edition
ISBN:9780079039897
Author:Carter
Publisher:Carter
Chapter10: Statistics
Section10.4: Distributions Of Data
Problem 20PFA

Related questions
Question
1
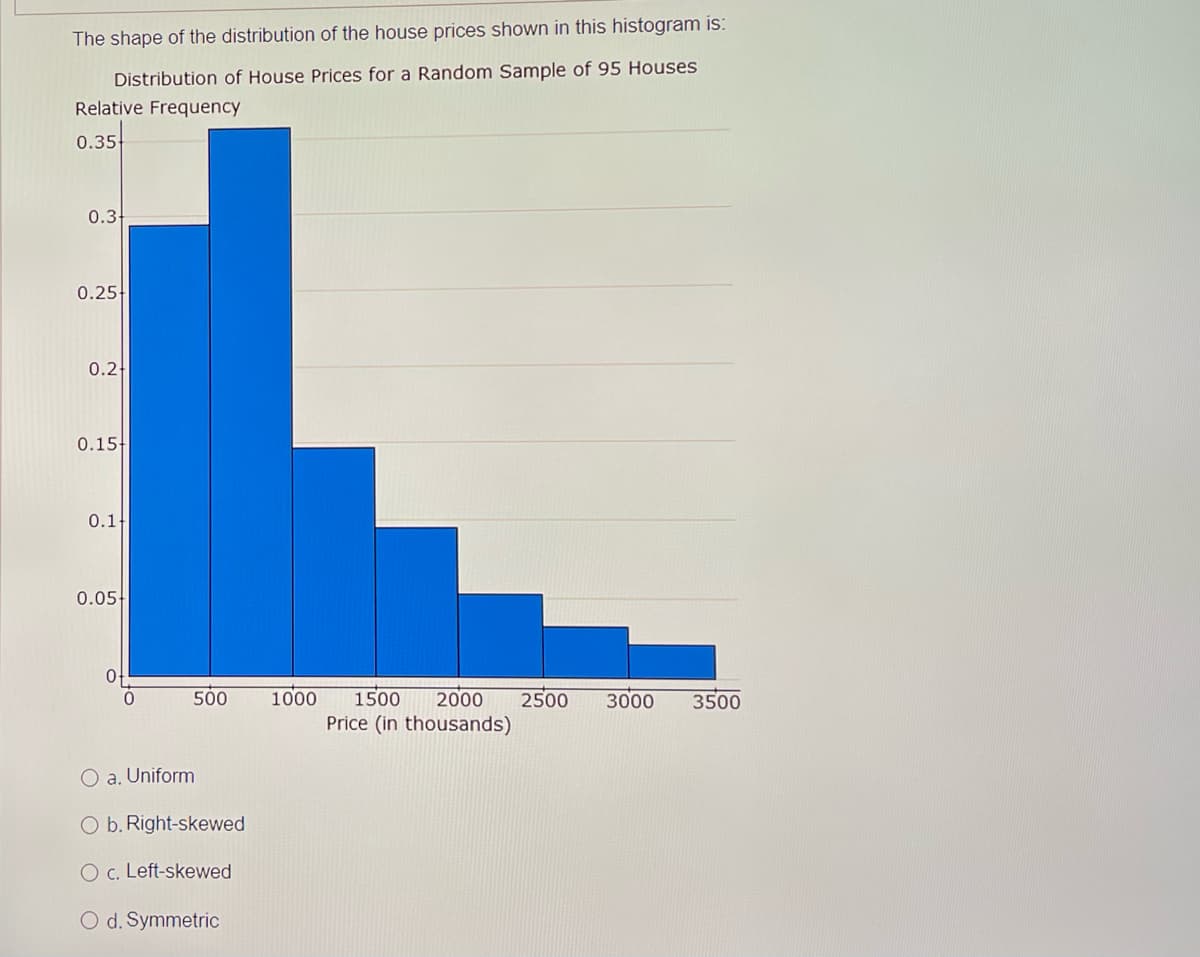
Transcribed Image Text:The shape of the distribution of the house prices shown in this histogram is:
Distribution of House Prices for a Random Sample of 95 Houses
Relative Frequency
0.35
0.3-
0.25
0.2
0.15
0.1
0.05
500
1000
1500
2000
2500
3000
3500
Price (in thousands)
O a. Uniform
O b. Right-skewed
O c. Left-skewed
O d. Symmetric
Expert Solution
This question has been solved!
Explore an expertly crafted, step-by-step solution for a thorough understanding of key concepts.

This is a popular solution!

Trending now
This is a popular solution!

Step by step
Solved in 2 steps

Recommended textbooks for you
Glencoe Algebra 1, Student Edition, 9780079039897…
Algebra
ISBN:
9780079039897
Author:
Carter
Publisher:
McGraw Hill
Glencoe Algebra 1, Student Edition, 9780079039897…
Algebra
ISBN:
9780079039897
Author:
Carter
Publisher:
McGraw Hill