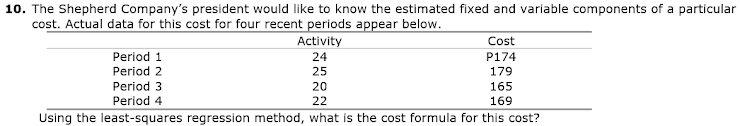
The Shepherd Companys president would like to know the estimated fixed and variable components of a particular cost. Actual data for this cost for four recent periods appear below. Activity Cost Period 1 24 P174 179 Period 2 25 Reriod ? 20 165


Q: sing the data in test yourself question 1, if the price of X to consumers is $9, and the government…
A:
Q: 4. The cost function for a commodity is given by Ctx) = 5-2x, what is the margiral average cost…
A: As per guideline we have to solve one question
Q: The average cost/unit for the production of a particular component at a manufacturing plant varies…
A: The cost per unit is Let the demand be nThe profit of selling n units =n*Selling price - n*cost per…
Q: compared to its age.Construct a scatterplot for the given data. Age of Car (years) Listed Cost…
A:
Q: (a) Write down the associated cost function C(x) in dollars. C(x) = Write down the revenue…
A: Definition used - Profit = revenue -cost P(x)=…
Q: Given the following data for demand at the XYZ Company, calculate the monthly forecast for 2003…
A: Forecast are used to determine the future value over a period of time. Error in forecast can be…
Q: The costs of preparation for the issuance and sale of a new type of product of $2080. Draw the graph…
A: According to the given data: The costs of preparation for the issuance and sale of a new type of…
Q: Aiman recently graduated from engineering school and has taken a position as assistant manager at a…
A: forecasting methods
Q: Consider the Honduran market for soybeans. The following graph shows the domestic demand and…
A: Total Surplus s2 TS =CS+PS = [0.5*125*(380-305)] + [0.5*125*(305-230)] = 4687.5+4687.5 = 9375
Q: Your college newspaper, The Collegiate Investigator, has fixed production costs of $72 per edition…
A: It is given that the newspaper has a fixed production cost of $72 per edition and a marginal…
Q: Your college newspaper, The Collegiate Investigator, has fixed production costs of $74 per edition…
A:
Q: Given cost function C(q) = q° - 130q +24000q, what is the minimum average cost? 3 It would be $ per…
A: Given function C(q)=q3-130q2+24000q. The objective is to find the minimum average cost.
Q: Example 15. Find Average cost and Marginal cost, ifT=1000+ 100g – 10g? + q³.
A:
Q: Table: Data of House Value versus Rental Value Rental Value Rental Value Rental Value…
A: Given data, Value Rental 81000 6656 95000 7904 121000 12064 135000 8320 145000 8320…
Q: dentify each of the following as examples of qualitative and quantitative variables.
A: here use definition of qualitative and quantitative variable quantitative variable are those is…
Q: Assume that the situation can be expressed as a linear cost function. Find the cost function in this…
A: use linear equation of cost function and satisfy value
Q: Q1. Find four years weighted moving average? Forecast for 2019 with weights 1,4,2, .. , Also find…
A: Given weights = 0.1, 0.4 and 0.2 Total weight should be 1 so fourth weight is = 1-(0.4+0.2+0.1) =…
Q: 14.28 Find the equation that best fits the following set of data points. Compare the actual and…
A:
Q: Please complete each section (A, B-1, B-2). Given the series of demand data below Period: Demandi a.…
A: Given Observations Period Demand 1 45 2 32 3 49 4 41 5 22 6 48 7 37 8 41 9 26…
Q: A firm's short-run cost curve is C(Q) = 100 + 50Q – bQ? + Q*/2. For what values of b are cost,…
A: Given: A firm’s short-run cost curve as C(Q)=100+50Q-bQ2+Q32 The values of cost, average cost and…
Q: Suppose Mai estimates two demand curves, one for data collected over a two-week period for her…
A: In regression analysis, R2 is a statistical measurement that represent how well a model explain the…
Q: XYZ Company, Annual Data Actual Demand. Forecasted Demand 15 14 15…
A: The formula for mean absolute deviation is MAD = (Σ|At – Ft|)/n, where At is the actual value and Ft…
Q: You have to examine the relationship between the age and price for used cars sold in the last year…
A: We use R to do the derive a regression line for the given data.
Q: Using the data above, find the main effect of coffee consumption. 1) Provide the marginal means for…
A: From the given information, Coffee No Coffee Before 6 PM 0.9 0.85 After 6 PM 2.4 1.1…
Q: i. Complete the table by calculating the two measures of productivity (APL and MPL) and the various…
A:
Q: A contractor was awarded a contract to build a 600 meter long tunnel. During the 5-year contract,…
A: A contractor awarded a contract of 600 meter long tunnel. Time period is 5 years Total Pump operate…
Q: Below is data collected over 6 specific years. The data collected is the Consumer Price Index (CPI)…
A: These are the data that have been provided for the dependent and independent variables: Obs. XX…
Q: Past sales for months 1 to 5 of a large equipment are shown below. Month 1 2 3 4 5 Actual Demands 12…
A: From the given information we forecast for 6 using least squared equation
Q: The records shown in the table provide an excellent opportunity for you to assist them with their…
A:
Q: A.) Calculate the Manginal revenue and Profit functions
A:
Q: If it costs Microsoft $1,230 to manufacture 8 Kinects per hour for the Xbox 360 and $2,430 to…
A:
Q: Use the following sales data: Week Sales 1 30 2…
A: a) We know that, in naive method we can calculate forecast value as, We get result as, Using…
Q: Monthly data for the demand of an item are shown in the table below. 1 2 3 45 6 Month Demand 93 99…
A: The given table is as follows:
Q: Consider the following quarterly demand level for electricity (in 1000 megawatts) in Mankweng from…
A: Hello! As you have posted more than 3 sub parts, we are answering the first 3 sub-parts. In case…
Q: The specification for the diameters of ball bearings is 15.40–15.60 mm. Data from an X chart, based…
A: a).
Q: The amount of water used by the production facilities of a plant varies. Observations on water usage…
A: Sample size, n= 17*5= 85 Total d.f. =n-1= 84 k= 5 D.f.(model)= k-1= 4 D.f.(error)= n-k= 80 SST=…
Q: if known the data from one of the Toyota car sales agents, one of which is selling the Avanza type,…
A: part a we derived the demand fuction. now we shall plot the same on the graph. given points are…
Q: T 9. 11 12 data 13 14 15 16 7 8 10 Based on the boxplot above, what is the value for the minimum…
A: Solution : A box plot consist of Minimum, first quartile, median, third quartile and maximum.
Q: In 1976 the average price of a commodity was 20% more than in 1975. but 20% less than in 1974 and it…
A:
Q: Given cost function C(q) = q° - 125q + 25000q, what is the minimum average cost? It would be $ per…
A:
Q: Your college newspaper, The Collegiate Investigator, has fixed production costs of $74 per edition…
A: Given query is to find the cost revenue and profit function.
Q: Your college newspaper, The Collegiate Investigator, has fixed production costs of $76 per edition…
A:
Q: For the supply function s(x) and demand level x, find the producers' surplus.
A: It is given that sx=0.06x and x=200. Recall the fact that the producer's surplus is given by the…
Q: The market research department of a soft drink manufacturer is investigating the effectiveness of a…
A: Given:
Q: For the given cost function C(x) = 19600 + 600x + x, First, find the average cost function. Use it…
A:
Q: Given cost function C(q) = q - 135q + 25000q, what is the minimum average cost? It would be $ per…
A: minimum value
Q: Period 1 2 3 4 5 6 7 Actual 42 41 39 43 45 F ? ? 2 2. Using the same table above, compute the…
A: The question is about forecast analysis Given : Weight for the most recent ( w1 ) = 0.40 Weight for…
Q: The attached table shows the marginal costs of abatement for two power plants in the country of…
A: Solution Let us consider plant A MC of pollution abatement is less than the marginal cost of…
Q: Given cost function C(q) = q° - 130q + 24000q, what is the minimum average cost? per item. (Round to…
A: The cost function Cq=q3-130q2+24000q
Q: Your college newspaper, The Collegiate Investigator, has fixed production costs of $72 per edition…
A:

Step by step
Solved in 2 steps with 1 images

- Olympic Pole Vault The graph in Figure 7 indicates that in recent years the winning Olympic men’s pole vault height has fallen below the value predicted by the regression line in Example 2. This might have occurred because when the pole vault was a new event there was much room for improvement in vaulters’ performances, whereas now even the best training can produce only incremental advances. Let’s see whether concentrating on more recent results gives a better predictor of future records. (a) Use the data in Table 2 (page 176) to complete the table of winning pole vault heights shown in the margin. (Note that we are using x=0 to correspond to the year 1972, where this restricted data set begins.) (b) Find the regression line for the data in part ‚(a). (c) Plot the data and the regression line on the same axes. Does the regression line seem to provide a good model for the data? (d) What does the regression line predict as the winning pole vault height for the 2012 Olympics? Compare this predicted value to the actual 2012 winning height of 5.97 m, as described on page 177. Has this new regression line provided a better prediction than the line in Example 2?An agent for a residential real estate company in a large city would like to be able to predict the monthly rental cost for apartments, based on the size of an apartment, as defined by square footage. The agent selects a sample of 25 apartments in a particular residential neighborhood and gathers the following data a. Construct a scatter plot. b. Use the least-squares method to determine the regression coefficients b0 and b1 c. Interpret the meaning of and in this problem. d. Predict the monthly rent for an apartment that has 1,000 square feetThe following activity and cost data that were provided by Hoist Corporation would help in estimating its future maintenance costs: Units Maintenance cost 3 P1,350 7 P1,590 11 P1,920 15 P2,100 Using the least squares regression method to estimates the cost formula, the expected total cost for an activity level of 10 units would be closest to:
- Suppose Tatiyana is interested in the relationship between language ability and time spent reading. She randomly selects a sample of 30 students from the local high school and collects their scores from a language aptitude test. She surveys the sample asking each student how many hours per month he or she spends reading. Using the sample data, Tatiyana produces a scatterplot with reading time on the horizontal axis and language test scores on the vertical axis. She develops a least squares regression equation where ? is the amount of time spent reading during the month and ?̂ is the predicted value of the language test score. ?̂=3.251x+31.237 Compute the value of ?̂ when a student spends 42 hours reading. Give your answer precise to one decimal place. Avoid rounding until the last step. ?̂= ? points Identify all of the true statements regarding the interpretation of ?̂ when ?=42. The value of ?̂ is ? a. the predicted number of students that read for 42 hours. b. the language test…The following information pertains to a simple least squares regression for DEF Corporation: Mean value of the dependent variable 30Mean value of the independent variable 8Coefficient of the independent variable 3Number of observations 12 What is the "a" value for the leasts-quares regression model? a. 60b. 30c. 6d. 0The regional transit authority for a major metropolitan area wants to determine whetherthere is any relationship between the age of a bus and the annual maintenance cost. Asample of 10 buses resulted in the following data. Age of Bus (year) Maintenance Cost ($) 1 350 2 370 2 480 2 520 2 590 3 550 4 750 4 800 5 790 5 950 a. Develop the least squares estimated regression equation.b. Test to see whether the two variables are significantly related with α = .5.c. Did the least squares line provide a good fit to the observed data? Explain.d. Develop a 95% prediction interval for the maintenance cost for a specific bus thatis 4 years old.
- A pediatrician wants to determine the relationship that exists between achild’s height, x, and head circumference, y. She randomly selects 11 children from her practice, measures their heights and head circumferences, and conducts the least-squares regression analysis with the simple linear model using StatCrunch. The output is given below: (a) Write down the equation of the least-squares regression line treating height as the explanatory variable and head circumference as the response variable. (b) Interpret the slope and y-intercept, if appropriate. (c) Use the regression equation to predict the head circumference of a child who is 25 inches tall. Assume that the regression model is applicable.(d) It is observed that one child who is 25 inches tall has a head circumference of 17.5 inches. Is the observed value above or below average among all children with heights of 25 inches?Solve the following problems completely. An article in the Journal of Environmental Engineering (1989, Vol. 115(3), reported the results of a study on the occurrence of sodium and chloride in surface streams in central Rhode Island. The following data are chloride concentration y (in milligrams per liter) and roadway area in the watershed x (in percentage). Draw a scatter diagram of the data. Fit the simple linear regression model using the method of least squares. Find an estimate of σ2. Estimate the mean chloride concentration for a watershed that has 1% roadway area. Find the fitted value corresponding to x = 0.47 and the associated residual. Test the hypothesis H0: β1 = 0 versus H1: β1 ≠ 0 using the analysis of variance procedure with α = 0.01. Find a 99% confidence interval of Mean chloride concentration when roadway area x = 1.0% Find a 99% prediction interval on chloride concentration when roadway area x = 1.0%. Plot the residuals versus ŷ and versus x. Interpret these plots.…1) Calculate the slope b1 and intercept b0 of the least squares prediction line y = b0 + b1x where the x-variable is time spent on Facebook and the y-variable is GPA. a) slope b) intercept 2) what is the predicted GPA of a student that spends 60 minutes a day on Facebook?
- A researcher collected data on the cholesterol level, CC, and the age, AA, of 24 people selected at random. Using the data, the researcher calculated the least-squares regression line to be Cˆ=182+2.2AC^=182+2.2A and the standard error of the slope to be 0.38. If the conditions for inference are met, which of the following is closest to the value of the test statistic to test the hypotheses H0:β=0H0:β=0 versus Ha:β≠0Ha:β≠0 ?Given are five observations for two variables, x and y. xi 3 8 12 18 20 yi 54 57 50 24 11 -select your answer choices- b. The least squares line provided an (good, bad) fit; __ % of the variability in y has been explained by the estimated regression equation (to 1 decimal)The following table shows the length, in centimeters, of the humerus and the total wingspan, in centimeters, of several pterosaurs, which are extinct flying reptiles. (A graphing calculator is recommended.) (a) Find the equation of the least-squares regression line for the data. (Where × is the independent variable.) Round constants to the nearest hundredth. y= ? (b) Use the equation from part (a) to determine, to the nearest centimeter, the projected wingspan of a pterosaur if its humerus is 52 centimeters. ? cm
