The simple linear regression model in the exhibit 2 data shows that, Both the intercept and the IDV are not significant at 0.05 significance level Only the IDV is significant at 0.01 significance level Both the intercept and the IDV are significant at 0.10 significance level Neither a, nor b, nor c above
The simple linear regression model in the exhibit 2 data shows that, Both the intercept and the IDV are not significant at 0.05 significance level Only the IDV is significant at 0.01 significance level Both the intercept and the IDV are significant at 0.10 significance level Neither a, nor b, nor c above

Managerial Economics: Applications, Strategies and Tactics (MindTap Course List)
14th Edition
ISBN:9781305506381
Author:James R. McGuigan, R. Charles Moyer, Frederick H.deB. Harris
Publisher:James R. McGuigan, R. Charles Moyer, Frederick H.deB. Harris
Chapter4: Estimating Demand
Section: Chapter Questions
Problem 1E

Related questions
Question
![QUESTION 2
ID1
The simple linear regression model in the exhibit 2
data shows that,
O Both the intercept and the IDV are not significant at 0.05 significance level
O Only the IDV is significant at 0.01 significance level
O Both the intercept and the IDV are significant at 0.10 significance level
O Neither a, nor b, nor c above
QUESTION 3
ID1
The quadratic model [scales sold hat = bo + b1*(months employed) + b2*(months employed)2] in the exhibit 2 data shows that,
O All IDVS are significant at alpha = 0.01 level
O Only "months employed" is significant at alpha = 0.01 level
O Only the intercept is significant at alpha = 0.01 level
O Neither a, nor b, nor c above](/v2/_next/image?url=https%3A%2F%2Fcontent.bartleby.com%2Fqna-images%2Fquestion%2Fffbabd2a-04a8-4cf8-83d0-36999fd956af%2Fa6155de7-4d55-469f-9cf4-e3bc051bc34e%2F9qepd9_processed.png&w=3840&q=75)
Transcribed Image Text:QUESTION 2
ID1
The simple linear regression model in the exhibit 2
data shows that,
O Both the intercept and the IDV are not significant at 0.05 significance level
O Only the IDV is significant at 0.01 significance level
O Both the intercept and the IDV are significant at 0.10 significance level
O Neither a, nor b, nor c above
QUESTION 3
ID1
The quadratic model [scales sold hat = bo + b1*(months employed) + b2*(months employed)2] in the exhibit 2 data shows that,
O All IDVS are significant at alpha = 0.01 level
O Only "months employed" is significant at alpha = 0.01 level
O Only the intercept is significant at alpha = 0.01 level
O Neither a, nor b, nor c above
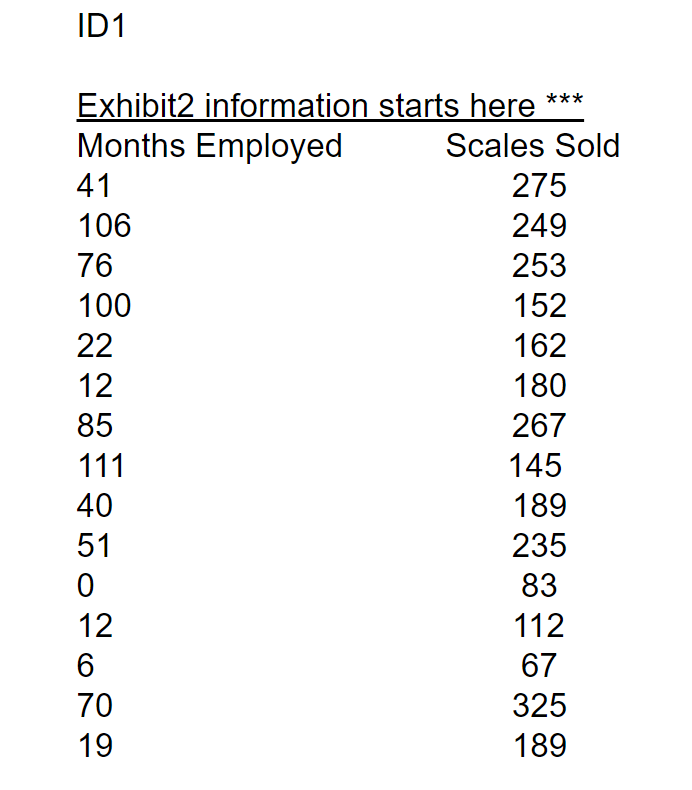
Transcribed Image Text:ID1
Exhibit2 information starts here ***
Months Employed
Scales Sold
41
275
106
249
76
253
100
152
22
162
12
180
85
267
111
145
40
189
51
235
83
12
112
67
70
325
19
189
Expert Solution
This question has been solved!
Explore an expertly crafted, step-by-step solution for a thorough understanding of key concepts.

Step by step
Solved in 3 steps with 1 images

Knowledge Booster


Learn more about
Need a deep-dive on the concept behind this application? Look no further. Learn more about this topic, economics and related others by exploring similar questions and additional content below.Recommended textbooks for you
Managerial Economics: Applications, Strategies an…
Economics
ISBN:
9781305506381
Author:
James R. McGuigan, R. Charles Moyer, Frederick H.deB. Harris
Publisher:
Cengage Learning
Managerial Economics: Applications, Strategies an…
Economics
ISBN:
9781305506381
Author:
James R. McGuigan, R. Charles Moyer, Frederick H.deB. Harris
Publisher:
Cengage Learning