The Springfield School Board has made the decision to close one of its middle schools (sixth, seventh, and eighth grades) at the end of this school year and reassign all of next year's middle school students to the three remaining middle schools. The school district provides busing for all middle school students who must travel more than approximately a mile, so the school board wants a plan for reassigning the students that will minimize the total busing cost. The annual cost per student for busing from each of the six residential areas of the city to each of the schools is shown in the following table (along with other basic data for next year), where 0 indicates that busing is not needed and a dash indicates an infeasible assignment. Area 1 2 3 4 5 6 Number of Students 450 600 550 350 500 450 Percentage in 6th Percentage in 7th Percentage in Grade Grade 8th Grade 32 38 37 28 30 32 28 40 34 28 39 34 30 35 38 32 27 38 School Capacity School 1 $ 300 600 200 0 500 900 Busing Cost per Student School 2 $0 400 300 500 300 1,100 School 3 $ 700 500 200 400 0 1,000 The school board also has imposed the restriction that each grade must constitute between 30 and 36 percent of each school's population. The above table shows the percentage of each area's middle school population for next year that falls into each of the three grades. The school attendance zone boundaries can be drawn so as to split any given area among more than one school, but assume that the percentages shown in the table will continue to hold for any partial assignment of an area to a school. You have been hired as a management science consultant to assist the school board in determining how many students in each area should be assigned to each school.
The Springfield School Board has made the decision to close one of its middle schools (sixth, seventh, and eighth grades) at the end of this school year and reassign all of next year's middle school students to the three remaining middle schools. The school district provides busing for all middle school students who must travel more than approximately a mile, so the school board wants a plan for reassigning the students that will minimize the total busing cost. The annual cost per student for busing from each of the six residential areas of the city to each of the schools is shown in the following table (along with other basic data for next year), where 0 indicates that busing is not needed and a dash indicates an infeasible assignment. Area 1 2 3 4 5 6 Number of Students 450 600 550 350 500 450 Percentage in 6th Percentage in 7th Percentage in Grade Grade 8th Grade 32 38 37 28 30 32 28 40 34 28 39 34 30 35 38 32 27 38 School Capacity School 1 $ 300 600 200 0 500 900 Busing Cost per Student School 2 $0 400 300 500 300 1,100 School 3 $ 700 500 200 400 0 1,000 The school board also has imposed the restriction that each grade must constitute between 30 and 36 percent of each school's population. The above table shows the percentage of each area's middle school population for next year that falls into each of the three grades. The school attendance zone boundaries can be drawn so as to split any given area among more than one school, but assume that the percentages shown in the table will continue to hold for any partial assignment of an area to a school. You have been hired as a management science consultant to assist the school board in determining how many students in each area should be assigned to each school.

Practical Management Science
6th Edition
ISBN:9781337406659
Author:WINSTON, Wayne L.
Publisher:WINSTON, Wayne L.
Chapter5: Network Models
Section: Chapter Questions
Problem 45P

Related questions
Question
DO ONLY PART 3 AND THE QUESTIONS PROVIDED. I WILL UPVOTE ALL THANK YOU. BETTER IF EXCEL SOLVER WITH FORMULAS. MUCH APPRECIATED
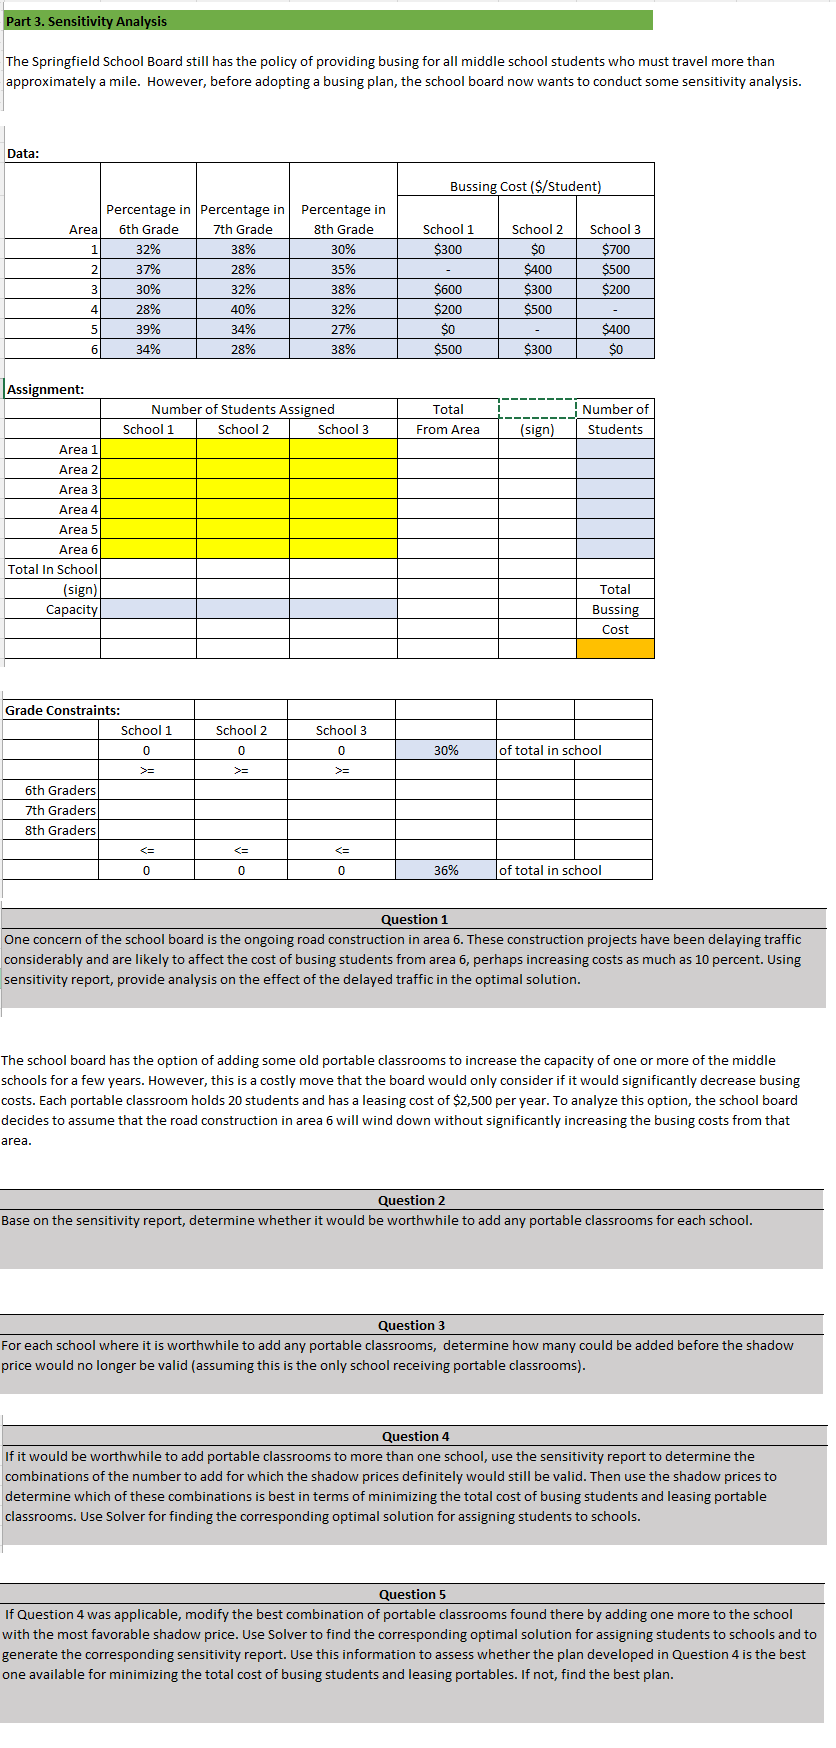
Transcribed Image Text:Part 3. Sensitivity Analysis
The Springfield School Board still has the policy of providing busing for all middle school students who must travel more than
approximately a mile. However, before adopting a busing plan, the school board now wants to conduct some sensitivity analysis.
Data:
Area
1
Assignment:
2
3
4
5
6
Area
Area 2
Area 3
Area 4
Area 5
Area 6
Total In School
(sign)
Capacity
Percentage in Percentage in Percentage in
6th Grade
7th Grade
8th Grade
Grade Constraints:
6th Graders
7th Graders
8th Graders
32%
37%
30%
28%
39%
34%
School 1
Number of Students Assigned
School 2
School 1
0
38%
28%
32%
40%
34%
28%
<=
0
School 2
0
30%
35%
38%
32%
27%
38%
<=
0
School 3
School 3
0
>=
0
Bussing Cost ($/Student)
School 1
$300
$600
$200
$0
$500
Total
From Area
30%
36%
School 2
$0
$400
$300
$500
$300
(sign)
School 3
$700
$500
$200
$400
$0
-
Number of
Students
Total
Bussing
Cost
of total in school
of total in school
Question 1
One concern of the school board is the ongoing road construction in area 6. These construction projects have been delaying traffic
considerably and are likely to affect the cost of busing students from area 6, perhaps increasing costs as much as 10 percent. Using
sensitivity report, provide analysis on the effect of the delayed traffic in the optimal solution.
The school board has the option of adding some old portable classrooms to increase the capacity of one or more of the middle
schools for a few years. However, this is a costly move that the board would only consider if it would significantly decrease busing
costs. Each portable classroom holds 20 students and has a leasing cost of $2,500 per year. To analyze this option, the school board
decides to assume that the road construction in area 6 will wind down without significantly increasing the busing costs from that
area.
Question 2
Base on the sensitivity report, determine whether it would be worthwhile to add any portable classrooms for each school.
Question 3
For each school where it is worthwhile to add any portable classrooms, determine how many could be added before the shadow
price would no longer be valid (assuming this is the only school receiving portable classrooms).
Question 4
If it would be worthwhile to add portable classrooms to more than one school, use the sensitivity report to determine the
combinations of the number to add for which the shadow prices definitely would still be valid.Then use the shadow prices to
determine which of these combinations is best in terms of minimizing the total cost of busing students and leasing portable
classrooms. Use Solver for finding the corresponding optimal solution for assigning students to schools.
Question 5
If Question 4 was applicable, modify the best combination of portable classrooms found there by adding one more to the school
with the most favorable shadow price. Use Solver to find the corresponding optimal solution for assigning students to schools and to
generate the corresponding sensitivity report. Use this information to assess whether the plan developed in Question 4 is the best
one available for minimizing the total cost of busing students and leasing portables. If not, find the best plan.
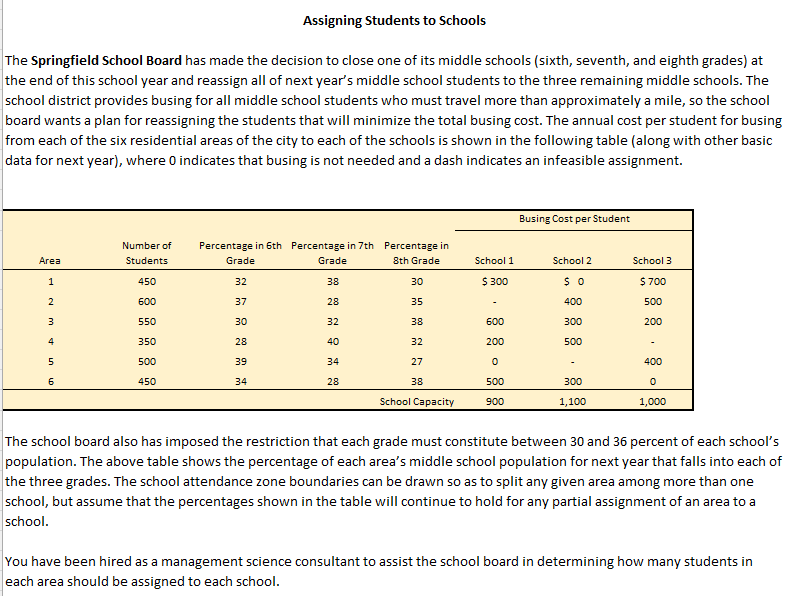
Transcribed Image Text:Assigning Students to Schools
The Springfield School Board has made the decision to close one of its middle schools (sixth, seventh, and eighth grades) at
the end of this school year and reassign all of next year's middle school students to the three remaining middle schools. The
school district provides busing for all middle school students who must travel more than approximately a mile, so the school
board wants a plan for reassigning the students that will minimize the total busing cost. The annual cost per student for busing
from each of the six residential areas of the city to each of the schools is shown in the following table (along with other basic
data for next year), where 0 indicates that busing is not needed and a dash indicates an infeasible assignment.
Area
1
2
3
mच
4
5
6
Number of
Students
450
600
550
350
500
450
Percentage in 6th Percentage in 7th Percentage in
Grade
8th Grade
Grade
38
28
32
40
34
28
32
37
30
28
39
34
30
35
38
32
27
38
School Capacity
School 1
$ 300
600
200
0
500
900
Busing Cost per Student
School 2
$0
400
300
500
300
1,100
School 3
$ 700
500
200
400
0
1,000
The school board also has imposed the restriction that each grade must constitute between 30 and 36 percent of each school's
population. The above table shows the percentage of each area's middle school population for next year that falls into each of
the three grades. The school attendance zone boundaries can be drawn so as to split any given area among more than one
school, but assume that the percentages shown in the table will continue to hold for any partial assignment of an area to a
school.
You have been hired as a management science consultant to assist the school board in determining how many students in
each area should be assigned to each school.
Expert Solution
This question has been solved!
Explore an expertly crafted, step-by-step solution for a thorough understanding of key concepts.

This is a popular solution!

Trending now
This is a popular solution!

Step by step
Solved in 5 steps with 9 images

Recommended textbooks for you
Practical Management Science
Operations Management
ISBN:
9781337406659
Author:
WINSTON, Wayne L.
Publisher:
Cengage,
Practical Management Science
Operations Management
ISBN:
9781337406659
Author:
WINSTON, Wayne L.
Publisher:
Cengage,