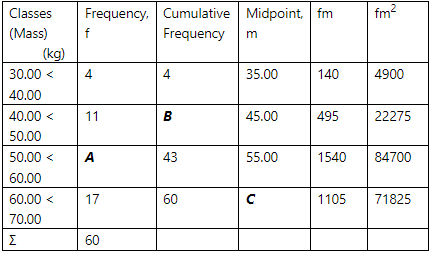
The standard deviation is closest to: A. 7.92kg B. 8.63kg C.8.04kg D.9.21kg


Q: What does it mean for a correlation coefficient to have a p < .02 significance level?
A: Correlation coefficient: The correlation coefficient measures the direction and strength of a linear…
Q: The number of cars running a red light in a day, at a given intersection, possesses a distribution…
A: From the provided information, Mean (µ) = 3 Standard deviation (σ) = 1 X~N (3, 1)
Q: (a) Do chemists differ significantly? Use a = 0.05 conduct a hypothesis test. (b) Analyze the…
A: To solve this problem we have make ANOVA table: we use R-code to make ANOVA table
Q: Might we be able to predict life expectancies from birthrates? Below are bivariate data giving…
A: From the given scatter plot and equation Find the required
Q: We want to conduct a hypothesis test of the claim that the population mean germination time of…
A: Given: .Population meanμ=16.9 Sample mean x¯=17Sample standard deviation (s)=1.5
Q: Construct a histogram and a frequency polygon
A: Frequency Table: Users can structure the information to respond to this inquiry by utilizing a…
Q: Refer to the following wage breakdown for a garment factory. Hourly Wages Number of Employees 18 $4…
A: Given information: Hourly Wages Number of employees $4 up to $7 18 $7 up to $10 36 $10 up…
Q: In a recent study, 50males used a new weight-loss supplement, and 38 of them experienced weight loss…
A: Concept: We will solve this problem using calculating percentage. percent (%) = proportion * 100…
Q: Q15. In a network of 39 computers, 4 have a copy of a particularly critical file to sustain an…
A: Given: N = 39 r = 4 n = 8 Formula Used: P(X=x) = Cxn×Cr-xN-nCrN
Q: Find the mean, variance, and standard deviation of the sampling distribution of the sample…
A: Given: n = 241 p = 0.6 Formula Used: Mean = np Variance = np(1-p) Standard deviation = np(1-p)
Q: different lakes, researchers classified the primary food choice (in volume) found in the alligator's…
A: This type of bar graph, with categories listed in order of frequency, has its special name as…
Q: a. Give an interval within which about 68% of the weights fall.
A: Data for 64 male college athletes was collected. The data on weight (in pounds) are roughly bell…
Q: The three most popular options on a certain type of new car are a built-in GPS (A), a sunroof (B),…
A: event A : has GPS B : has sunroof C : has automatic transmission P(A) = 0.53 P(B) = 0.60 P(C) = 0.76…
Q: Find a formula for the general term an of the sequence assuming the pattern of the first few terms…
A: Given that, 3, 3/1, 3/4, 3/8, 3/16 ....... We will fun last term
Q: In building materials laboratory, it has been observed that a failure proportion of concrete cubes…
A: Let X denote the number of failed sample. Given that X follows Poisson(λ = n.p = 300×0.05 = 15).…
Q: B 11.5 11.2 9.5 a dot plot. Construct Construct a frequency distrib Construct percent frequenc
A: dot plot : Any data that may be shown as dots or tiny circles is called a dot plot. Given that the…
Q: An executive's telephone log showed the lengths of 60 calls initiated during the last week of July.…
A: First we enter the given data set in excel sheet. To calculate 1st quartile in excel we use…
Q: (a) If we assume that the distribution of the temperature increases for the 29 men is symmetric and…
A: Given that n=29 and the session is given as 2.31±0.96 we have to find an interval that we…
Q: ease in product price the demand for labor, resulting in wages and employment. (Enter one word in…
A: Inflation is a measure of the rate of price increase in an economy for a basket of selected products…
Q: Let X be a random variable and c be a constant. Then Var(X+c) = Var(X), always. True False
A: In the above expression, c is constant and X is random variable. We know that, the variance of…
Q: Question 4 The following dataset represents the number of patients admitted to the Dhaka Medical…
A:
Q: QUESTION 3 For the following, classify them as quantitative or qualitative. If the variable is…
A: Since you have asked multiple question, we will solve the first question for you. If you want any…
Q: The following table of values gives a company's annual profits in millions of dollars. Rescale the…
A: Introduction: It is required to identify the R2 value for the exponential regression model fitted to…
Q: (a) Use Excel to find the quartiles. (Round your answers to 2 decimal place 1st quartile Median 3rd…
A: It is given that 1st quartile Q1 = 1.00 Median = 2.00 Interquartile Range = 3.25
Q: Classes Frequency, Cumulative Midpoint, fm (Mass) Frequency (kg) 30.00 < 40.00 40.00 < 50.00 50.00 <…
A:
Q: phone, that registered v asked whom they intend to vote for, and whether the debate changed their…
A: Given that : A political party wants to know the reaction of voters to a debate between the…
Q: The state would like to evaluate the usefulness of a program to randomly test high school athletes…
A: There are 20 schools in fort worth selected. Randomly selected 3 athletes from each school.
Q: The transition matrix for a Markov chain with three states is (0.3 0.5 0.21 0.6 0.3 0.1 0 01 For a…
A: The given transition matrix for a Markov chain has three states: { state 1, state 2, state 3} The…
Q: A company decides to investigate the amount of sick leave taken by its employees. A sample of seven…
A: Solution: Given information: The observation are 1, 1, 3, 0,0, 6,3 n= 7 observation
Q: technology managers. Determine the number of possible ways to form this committee if one particular…
A: Here given , there are total 15 engineers , 4 accountants and 5 IT managers . Committee consist 6…
Q: An organization is planning a raffle to sell 40 tickets. Each customer can only buy one ticket.…
A: It is given that a raffle to sell 40 tickets, there are three prizes to be awarded and five…
Q: The average (mean) score on an exam was 76.375 in a class consisting of 21 Administration students…
A: From the provided information, The average score on an exam was 76.375 consisting 21 Administration…
Q: the standard deviation for the following data: Find
A: Given data is Income per day No.of persons 0 - 100 4 100 - 200 8 200 - 300 9 300 - 400 10…
Q: Describe the who in the world of the study choose the correct answer below
A: Given: A research center conducts an extensive survey consisting of an interview and medical…
Q: A. What is the median? B. What is the mean? c. What is the precise median?
A: Given information: x f 0 2 1 4 2 2 3 1 4 3 5 2 6 1 7 1 8 1 9 2 10 1
Q: In February 2013, Sports Illustrated published a controversial article stating that football…
A: As per our company guidelines we are supposed to answer only first question. Kindly repost other…
Q: 9:34. An assess depreciated the machinery of his factory by 10% each in the first two years and by…
A:
Q: Noodles and Company tested consumer reaction to two spaghetti sauces. Each of 70 judges rated both…
A: Given information: No. of samples=2No. of observations in each sample=70Rate of scores=1-10
Q: * The table shows a frequency distribution of Mathematic session marks for 120 students in the…
A:
Q: You have no doubt seen a circle graph or pie chart many times. A circle graph is similar to a…
A: The pie chart for living arrangements of elderly in 1990 is given.
Q: The median of 2, 9, 3, 5, 4, 7, 10, 2, 3, 12 is = 5.5 4.5 4 3.5
A: Answer..
Q: Second Question: IFX-Geo(0.3) and Y-P(5) if X, and Y are independant (1) P(X=3|Y=2) (2)P(X + Y = 2)…
A:
Q: The data represent the age of world leaders on their day of inauguration. Find the five-number…
A: For the given data Find the five-number summary, and construct a boxplot for the data. Comment on…
Q: The binomial distribution is used to model the number of trials until the first success True…
A: We have given statement is The binomial distribution is used to model the number of trials until…
Q: Height has an approximately bell-shaped distribution. For a sample of heights of college students…
A: Given that: Sample mean and standard deviation for males: x¯=72s=4 Sample mean and standard…
Q: s all the residents of these 5 city blocks. What type of sample is this? A. Simple Random Sample B.…
A: Question : To conduct a door-to-door survey about crime victimization, a city official randomly…
Q: The following is the recent historical sales of Sony HDTV at a local Feb April 76 99 Month Actual…
A: Hi! Thank you for the question As per the honour code, We’ll answer the first question since the…
Q: A psychologist is studying the self image of smokers, which she measures by the self-image (SI)…
A: Suppose μ is the mean SI score for the population of all smokers.
Q: Why is a sample often a better way to obtain information about a population than a census? A. A…
A: Census:- In census,we collect our survey data from entire population. Sample :- In sample ,we…
Q: Based on the properties of the covariance and the correlation, which of the following is correct?…
A: Given: Relationship between varience, covariance and correlation coefficient?
The standard deviation is closest to:
A. 7.92kg B. 8.63kg C.8.04kg D.9.21kg

Step by step
Solved in 2 steps with 1 images

- Population Genetics In the study of population genetics, an important measure of inbreeding is the proportion of homozygous genotypesthat is, instances in which the two alleles carried at a particular site on an individuals chromosomes are both the same. For population in which blood-related individual mate, them is a higher than expected frequency of homozygous individuals. Examples of such populations include endangered or rare species, selectively bred breeds, and isolated populations. in general. the frequency of homozygous children from mating of blood-related parents is greater than that for children from unrelated parents Measured over a large number of generations, the proportion of heterozygous genotypesthat is, nonhomozygous genotypeschanges by a constant factor 1 from generation to generation. The factor 1 is a number between 0 and 1. If 1=0.75, for example then the proportion of heterozygous individuals in the population decreases by 25 in each generation In this case, after 10 generations, the proportion of heterozygous individuals in the population decreases by 94.37, since 0.7510=0.0563, or 5.63. In other words, 94.37 of the population is homozygous. For specific types of matings, the proportion of heterozygous genotypes can be related to that of previous generations and is found from an equation. For mating between siblings 1 can be determined as the largest value of for which 2=12+14. This equation comes from carefully accounting for the genotypes for the present generation the 2 term in terms of those previous two generations represented by for the parents generation and by the constant term of the grandparents generation. a Find both solutions to the quadratic equation above and identify which is 1 use a horizontal span of 1 to 1 in this exercise and the following exercise. b After 5 generations, what proportion of the population will be homozygous? c After 20 generations, what proportion of the population will be homozygous?Poverty and Dietary Calcium. Calcium is the most abundant mineral in the human body and has several important functions. Recommendations for calcium are provided in Dietary Reference Intakes, developed by the Institute of Medicine of the National Academy of Sciences. The recommended adequate intake (RAI) of calcium for adults (ages 19–50) is 1000 milligrams (mg) per day. If adults with incomes below the poverty level have a mean calcium intake equal to the RAI, what percentage of all samples of 18 such adults have mean calcium intakes of at most 947.4 mg? Assume that σ = 188 mg. State any assumptions that you are making in solving this problem.Twins In 2000 The Journal of the American MedicalAssociation published a study that examined a sample ofpregnancies that resulted in the birth of twins. Birthswere classified as preterm with intervention (inducedlabor or cesarean), preterm without such procedures, or term or postterm. Researchers also classified the pregnan-cies by the level of prenatal medical care the mother received (inadequate, adequate, or intensive). The data,from the years 1995–1997, are summarized in the tablebelow. Figures are in thousands of births. (JAMA 284[2000]: 335–341)Is there evidence of an association between the durationof the pregnancy and the level of care received by themother? Twin Births, 1995–1997 (in Thousands)Preterm(induced orCesarean)Preterm(withoutprocedures)Term orpostterm Total Level ofPrenatal CareIntensive 18 15 28 61Adequate 46 43 65 154Inadequate 12 13 38 63Total 76 71 131 278
- Reliability Engineering exerciseAfter the pandemic hit and people were forced to spend more time indoors, there have been a suspicion among health professionals. that people are eating more and thus gaining weight. In 2018, the average weight of 192 pounds, and health experts want to know if that average weight of the American male has gone up during this pandemic. a. What is the population for which inferencing is being done in this problem? b. What is the population parameter for which inferencing is being done? c. Formulate the hypotheses that can be used by the health expert to confirm their suspisionMedian House Value ($) Walkability (1 is good, 2 is fair, and 3 is bad) 509,300 1 251,800 2 220,100 3 242,600 2 417,400 1 356,900 2 191,700 3 281,300 2 145,200 3 161,800 3 170,000 3 167,900 3 425,100 1 179,100 3 785,100 1 310,300 2 152,600 3 362,100 1 439,000 1 344,800 2 532,300 1 345,900 2 236,400 2…
- At noon time, customers arrive at Metrobank counter managed by a single cashier with mean arrival rate of 6 customers per hour. The cashier attends the customers on first come first served basis at 10 customers per hour.What is the waiting time of a customer in the system?[Econometrics] The World Bank hires you to analyze the effect of the introduction of new irrigation systems in a series of Sub-Saharan African countries. They are particularly interested on their effect in the crop production of each country. They give you data for each country on the kilometers of irrigation tubes constructed, the total crop harvest, as well as information on the average educational attainment for each year between 2000 and 2017. Which type of analysis would you perform based on this information?PETROGAS is testing new filters for its motorbikes. One brand of filter (Filter A) is placed in one motorbike, and the other brand (Filter B) is placed in the second motorbike. Random samples of air released from the motorbikes are taken at different times throughout the day. Pollutant concentrations are measured for both motorbikes at the same time. The following data attached represent the pollutant concentrations (in parts per million) for samples taken at 20 different times after passing through the filters. a. Test the hypothesis that the mean for the pollutant concentration for Filter B is greater than 30. Use the 1% level of significance. b. Construct a 95% confidence interval for the difference in mean pollutant concentration, where a difference is equal to the pollutant concentration passing through Filter A minus the passing through Filter B. c. Using the 5% significance level, determine whether there is evidence that mean for the pollutant concentration for Filter A…
- Nexium is a drug that can be used to reduce the acid produced by the body and heal damage to the esophagus. A researcher wants to estimate the proportion of patients taking Nexium that are healed within 8 weeks. A random sample of 224 patients suffering from acid reflux disease is obtained, and 213 of those patients were healed after 8 weeks. a. Identify the population of interest and sample of interest. what is the sample size? b. Describe the parameter of interest. c. Describe the statistic of interest. What value of the statistic obtained?Smartphone Battery Life. Battery life is an important issue for many smartphone owners. Public health studies have examined “low-battery anxiety” and acute anxiety called nomophobia that results when a smartphone user’s phone battery charge runs low and then dies (Wall Street Journal, https://www.wsj.com/articles/your-phone-is-almost-out-of-battery-remain-calm-call-a-doctor-1525449283). Battery life between charges for the Samsung Galaxy S9 averages 31 hours when the primary use is talk time and 10 hours when the primary use is Internet applications. Because the mean hours for talk time usage is greater than the mean hours for Internet usage, the question was raised as to whether the variance in hours of usage is also greater when the primary use is talk time. Sample data showing battery life between charges for the two applications follows. Primary Use: Talking35.8 22.2 24.0 32.6 18.5 42.5 28.0 23.8 30.0 22.8 20.3 35.5Primary Use: Internet14.0 12.5 16.4…Characteristics Treatment Control P-value Mean SBP 115.3889± 113.0588±6.805 Mean difference (SBP) -0.66±3.0292 2.117 ±2.471 0.005347 Mean DBP 74.556± 7.366 72.4705±6.374 Mean difference (DBP) -1.888±2.9483 1.411765 ±3.3343 0.002233 Mean Pulse rate 96.222±13.0 88.94±15.43725 Mean difference -9.444± 0.5294118± 0.3529523 write an analysis for the data above and what does the p value mean?


