The student was concerned that observation #45, which has an extremely large residual (~ -60), may be biasing their estimate of the slope of this relationship. Do you have this same concern? Why or why not?
The student was concerned that observation #45, which has an extremely large residual (~ -60), may be biasing their estimate of the slope of this relationship. Do you have this same concern? Why or why not?

Glencoe Algebra 1, Student Edition, 9780079039897, 0079039898, 2018
18th Edition
ISBN:9780079039897
Author:Carter
Publisher:Carter
Chapter10: Statistics
Section10.6: Summarizing Categorical Data
Problem 31PPS

Related questions
Question
URGENT PLEASE ANSWER ASAP
The student was concerned that observation #45, which has an extremely large residual (~ -60), may be biasing their estimate of the slope of this relationship. Do you have this same concern? Why or why not?
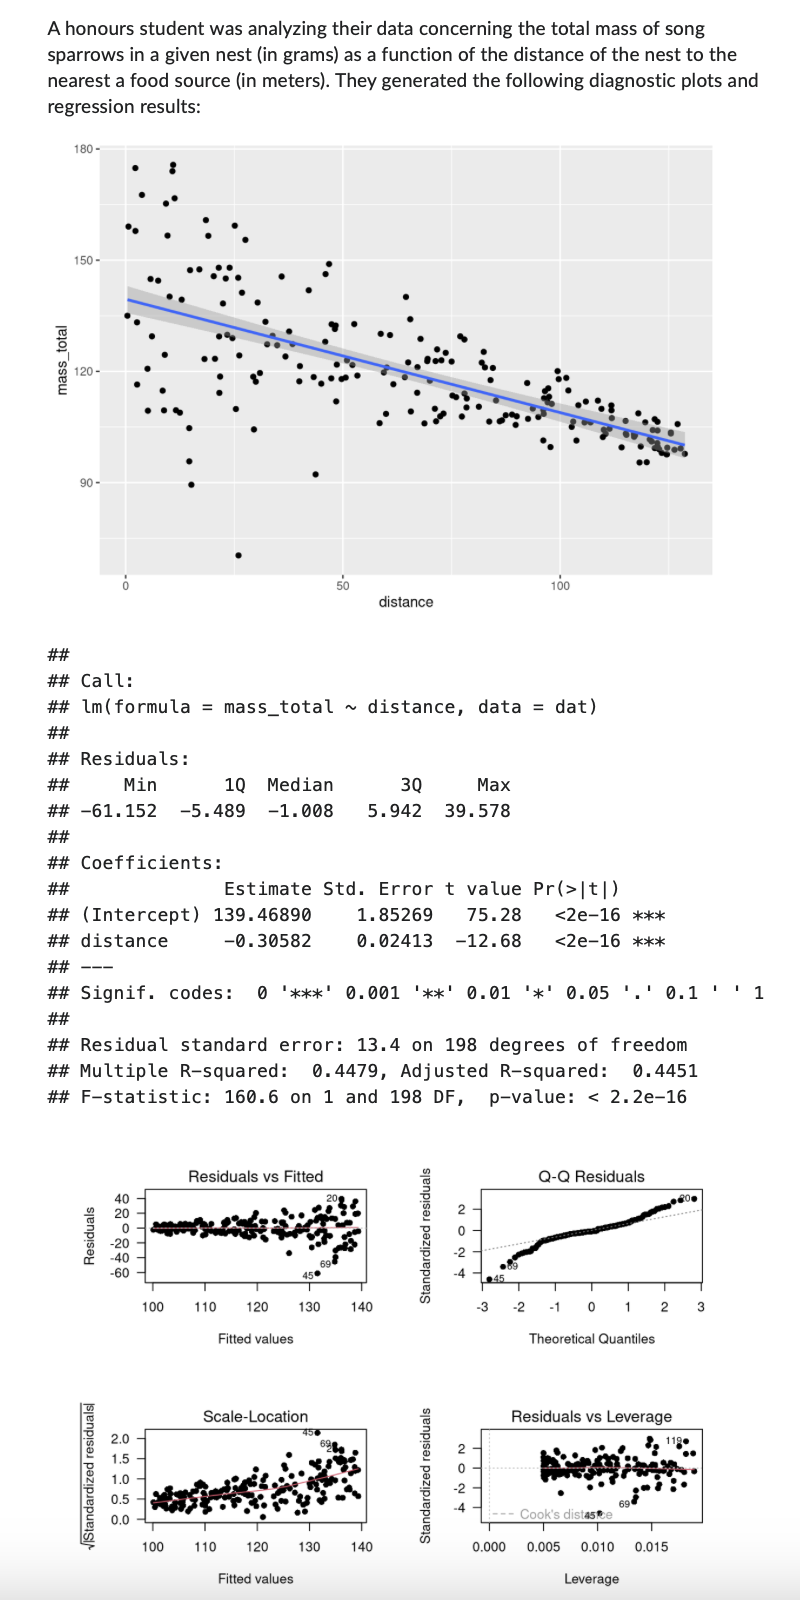
Transcribed Image Text:A honours student was analyzing their data concerning the total mass of song
sparrows in a given nest (in grams) as a function of the distance of the nest to the
nearest a food source (in meters). They generated the following diagnostic plots and
regression results:
mass_total
180-
150-
120-
90-
##
## Call:
## lm (formula = mass_total
Residuals
VIStandardized residuals
##
## Residuals:
##
Min
1Q Median
3Q
Max
## -61.152 -5.489 -1.008 5.942 39.578
##
## Coefficients:
##
## (Intercept)
## distance
## ---
## Signif. codes: 0 '***' 0.001
0 '***' 0.001 '**' 0.01 '*' 0.05 '.' 0.1'' 1
##
40
20
0
-20
-40
-60
2.0
1.5
1.0
0.5
0.0
## Residual standard error: 13.4 on 198 degrees of freedom
## Multiple R-squared: 0.4479, Adjusted R-squared: 0.4451
## F-statistic: 160.6 on 1 and 198 DF, p-value: < 2.2e-16
100
TTTT
Residuals vs Fitted
Estimate Std. Error t value Pr(>|t|)
139.46890
-0.30582
Fitted values
100 110
Scale-Location
50
450
110 120 130 140
120
Fitted values.
distance
distance, data = dat)
45€
1.85269 75.28
<2e-16 ***
0.02413 -12.68 <2e-16 ***
130 140
Standardized residuals
Standardized residuals
100
NON
-2
-4
NONT
45
Q-Q Residuals
T T
-3 -2 -1 0 1 2 3
Theoretical Quantiles
Residuals vs Leverage
Cook's distaste
0.000 0.005
69
119
0.010 0.015
Leverage
..
Expert Solution
This question has been solved!
Explore an expertly crafted, step-by-step solution for a thorough understanding of key concepts.

Step by step
Solved in 3 steps

Recommended textbooks for you
Glencoe Algebra 1, Student Edition, 9780079039897…
Algebra
ISBN:
9780079039897
Author:
Carter
Publisher:
McGraw Hill
Glencoe Algebra 1, Student Edition, 9780079039897…
Algebra
ISBN:
9780079039897
Author:
Carter
Publisher:
McGraw Hill