The supply function p(x) for a commodity gives the relation between the selling price and the number of units that manufacturers will produce at that price. For a higher price, manufacturers will produce more units, so p, is an increasing function of x. Let X be the amount of the commodity currently produced and let P = P(X) be the current price. Some producers would be willing to make and sell the commodity for a lower selling price and are therefore receiving more than their minimal price. The excess is called the producer surplus. An argument similar to that for consumer surplus shows that the surplus is given by the following integral. [P-Ps(x)] dx Calculate the producer surplus for the supply function p(x) = 5 + 0.03x2 at the sales level X = 10. (Round your answer to the nearest cent.) $ Illustrate by drawing the supply curve and identifying the producer surplus as an area.
The supply function p(x) for a commodity gives the relation between the selling price and the number of units that manufacturers will produce at that price. For a higher price, manufacturers will produce more units, so p, is an increasing function of x. Let X be the amount of the commodity currently produced and let P = P(X) be the current price. Some producers would be willing to make and sell the commodity for a lower selling price and are therefore receiving more than their minimal price. The excess is called the producer surplus. An argument similar to that for consumer surplus shows that the surplus is given by the following integral. [P-Ps(x)] dx Calculate the producer surplus for the supply function p(x) = 5 + 0.03x2 at the sales level X = 10. (Round your answer to the nearest cent.) $ Illustrate by drawing the supply curve and identifying the producer surplus as an area.

Chapter24: Perfect Competition
Section: Chapter Questions
Problem 14E

Related questions
Question
![The supply function p(x) for a commodity gives the relation between the selling price and the number of units that manufacturers will produce at that price. For a higher price, manufacturers will
produce more units, so p, is an increasing function of x. Let X be the amount of the commodity currently produced and let P = P(X) be the current price. Some producers would be willing to make and
sell the commodity for a lower selling price and are therefore receiving more than their minimal price. The excess is called the producer surplus. An argument similar to that for consumer surplus
shows that the surplus is given by the following integral.
Calculate the producer surplus for the supply function p(x) = 5 + 0.03x² at the sales level X = 10. (Round your answer to the nearest cent.)
$
6
Illustrate by drawing the supply curve and identifying the producer surplus as an area.
p(x)
p(x)
8
8
4
SIP-
2
[P-Ps(x)] dx
p(x)
Producer surplus
2
4
6
8
10
6
4
2
Producer surplus
2
4
6
8
10
DO
p(x)
8
6
4
Producer surplus
2
4
6
8
10
↑](/v2/_next/image?url=https%3A%2F%2Fcontent.bartleby.com%2Fqna-images%2Fquestion%2F170cb9b5-2292-4ecc-9f24-3c60291ff66d%2Fb36787b6-3c58-466e-b100-208f185624c4%2F3kky87a_processed.jpeg&w=3840&q=75)
Transcribed Image Text:The supply function p(x) for a commodity gives the relation between the selling price and the number of units that manufacturers will produce at that price. For a higher price, manufacturers will
produce more units, so p, is an increasing function of x. Let X be the amount of the commodity currently produced and let P = P(X) be the current price. Some producers would be willing to make and
sell the commodity for a lower selling price and are therefore receiving more than their minimal price. The excess is called the producer surplus. An argument similar to that for consumer surplus
shows that the surplus is given by the following integral.
Calculate the producer surplus for the supply function p(x) = 5 + 0.03x² at the sales level X = 10. (Round your answer to the nearest cent.)
$
6
Illustrate by drawing the supply curve and identifying the producer surplus as an area.
p(x)
p(x)
8
8
4
SIP-
2
[P-Ps(x)] dx
p(x)
Producer surplus
2
4
6
8
10
6
4
2
Producer surplus
2
4
6
8
10
DO
p(x)
8
6
4
Producer surplus
2
4
6
8
10
↑
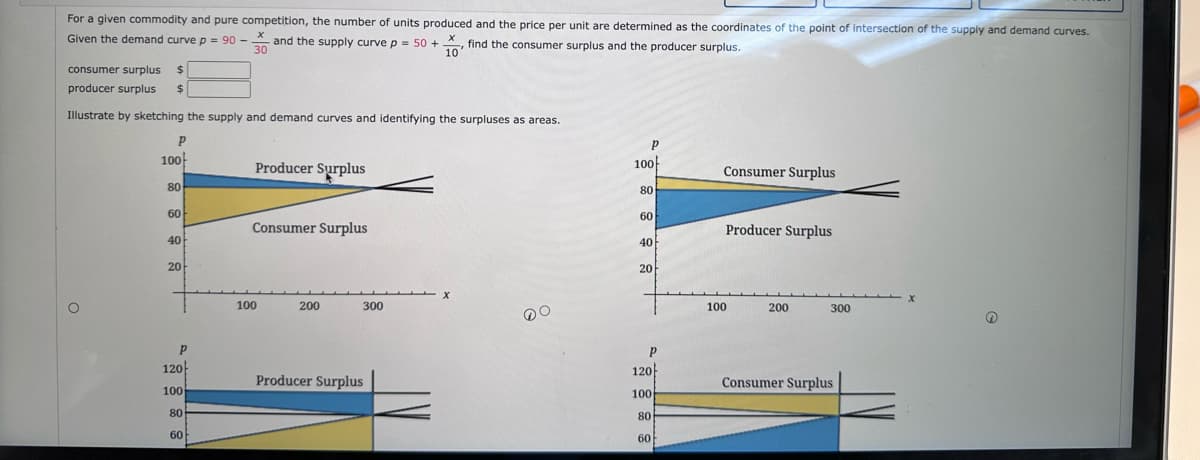
Transcribed Image Text:For a given commodity and pure competition, the number of units produced and the price per unit are determined as the coordinates of the point of intersection of the supply and demand curves.
Given the demand curve p = 90 - and the supply curve p = 50+, find the consumer surplus and the producer surplus.
10
consumer surplus $
producer surplus $
Illustrate by sketching the supply and demand curves and identifying the surpluses as areas.
P
100
80
60
40
20
P
120
100
80
60
Producer Surplus
Consumer Surplus
100
200
300
Producer Surplus
DO
P
100
80
60
40
20
P
120
100
80
60
Consumer Surplus
Producer Surplus
100
200
300
Consumer Surplus
→
Expert Solution
This question has been solved!
Explore an expertly crafted, step-by-step solution for a thorough understanding of key concepts.

This is a popular solution!

Trending now
This is a popular solution!

Step by step
Solved in 3 steps with 2 images

Knowledge Booster


Learn more about
Need a deep-dive on the concept behind this application? Look no further. Learn more about this topic, economics and related others by exploring similar questions and additional content below.Recommended textbooks for you