The table below gives data on students in a certain school who took the SAT. % taking SAT % who scored over 1000 Seniors Juniors Sophomores Freshmen 41% 30% 12% 17% 77% 70% 59% 49% The first column of numbers shows what percentage of the total pool of students came from each class. For example, 41% of those taking the SAT were seniors. (Notice that the numbers in this column add up to 100%.) The right column of numbers indicates what percentage of each group scored over 1000. For example, 77% of the Seniors scored over 1000. Use this data to construct a tree diagram similar to the one shown below. Your numbers will differ from those shown. In the tree, H represents those scoring "high" (over 1000) and L represents those scoring "low" (under 1000). 4852 34 42 So Use your tree to answer the following questions. (a) If you learn that a student (whom you know nothing else about) made over 1000 on the SAT, what then (based on that information) is the conditional probability the student is a senior? (b) If you learn that a student (whom you know nothing else about) made under 1000 on the SAT, what then (based on that information) is the conditional probability the student is a freshman?
The table below gives data on students in a certain school who took the SAT. % taking SAT % who scored over 1000 Seniors Juniors Sophomores Freshmen 41% 30% 12% 17% 77% 70% 59% 49% The first column of numbers shows what percentage of the total pool of students came from each class. For example, 41% of those taking the SAT were seniors. (Notice that the numbers in this column add up to 100%.) The right column of numbers indicates what percentage of each group scored over 1000. For example, 77% of the Seniors scored over 1000. Use this data to construct a tree diagram similar to the one shown below. Your numbers will differ from those shown. In the tree, H represents those scoring "high" (over 1000) and L represents those scoring "low" (under 1000). 4852 34 42 So Use your tree to answer the following questions. (a) If you learn that a student (whom you know nothing else about) made over 1000 on the SAT, what then (based on that information) is the conditional probability the student is a senior? (b) If you learn that a student (whom you know nothing else about) made under 1000 on the SAT, what then (based on that information) is the conditional probability the student is a freshman?

Linear Algebra: A Modern Introduction
4th Edition
ISBN:9781285463247
Author:David Poole
Publisher:David Poole
Chapter7: Distance And Approximation
Section7.3: Least Squares Approximation
Problem 29EQ

Related questions
Topic Video
Question
Transcribed Image Text:The table below gives data on students in a certain school who took the SAT.
% taking SAT
% who scored over 1000
Seniors
Juniors
Sophomores
Freshmen
41%
77%
30%
70%
12%
59%
17%
49%
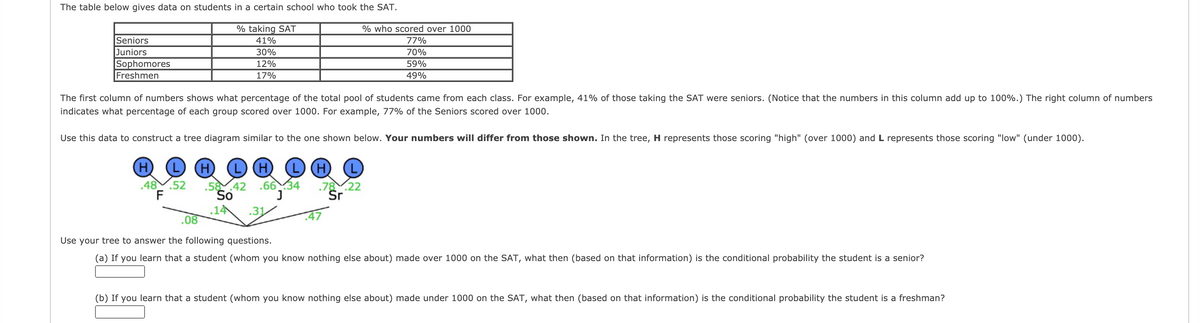
The first column of numbers shows what percentage of the total pool of students came from each class. For example, 41% of those taking the SAT were seniors. (Notice that the numbers in this column add up to 100%.) The right column of numbers
indicates what percentage of each group scored over 1000. For example, 77% of the Seniors scored over 1000.
Use this data to construct a tree diagram similar to the one shown below. Your numbers will differ from those shown. In the tree, H represents those scoring "high" (over 1000) and L represents those scoring "low" (under 1000).
52
.58 42
So
.6634
.78.22
Sr
48
.14
.08
Use your tree to answer the following questions.
(a) If you learn that a student (whom you know nothing else about) made over 1000 on the SAT, what then (based on that information) is the conditional probability the student is a senior?
(b) If you learn that a student (whom you know nothing else about) made under 1000 on the SAT, what then (based on that information) is the conditional probability the student is a freshman?
Expert Solution
This question has been solved!
Explore an expertly crafted, step-by-step solution for a thorough understanding of key concepts.

Step by step
Solved in 2 steps with 1 images

Knowledge Booster


Learn more about
Need a deep-dive on the concept behind this application? Look no further. Learn more about this topic, probability and related others by exploring similar questions and additional content below.Recommended textbooks for you
Linear Algebra: A Modern Introduction
Algebra
ISBN:
9781285463247
Author:
David Poole
Publisher:
Cengage Learning

Holt Mcdougal Larson Pre-algebra: Student Edition…
Algebra
ISBN:
9780547587776
Author:
HOLT MCDOUGAL
Publisher:
HOLT MCDOUGAL

Algebra & Trigonometry with Analytic Geometry
Algebra
ISBN:
9781133382119
Author:
Swokowski
Publisher:
Cengage
Linear Algebra: A Modern Introduction
Algebra
ISBN:
9781285463247
Author:
David Poole
Publisher:
Cengage Learning
Holt Mcdougal Larson Pre-algebra: Student Edition…
Algebra
ISBN:
9780547587776
Author:
HOLT MCDOUGAL
Publisher:
HOLT MCDOUGAL
Algebra & Trigonometry with Analytic Geometry
Algebra
ISBN:
9781133382119
Author:
Swokowski
Publisher:
Cengage

Glencoe Algebra 1, Student Edition, 9780079039897…
Algebra
ISBN:
9780079039897
Author:
Carter
Publisher:
McGraw Hill