The table below gives the annual sales (in millions) of a product. year 1998 1999 2000 2001 2002 2003 2004 2005 2006 sales 123 168 203 228 243 248 243 228 203 What was the average rate of change of annual sales a) between 1999 and 2000? millions of dollars/year b) between 1999 and 2001? millions of dollars/year Question Help: Dviden M
The table below gives the annual sales (in millions) of a product. year 1998 1999 2000 2001 2002 2003 2004 2005 2006 sales 123 168 203 228 243 248 243 228 203 What was the average rate of change of annual sales a) between 1999 and 2000? millions of dollars/year b) between 1999 and 2001? millions of dollars/year Question Help: Dviden M

Chapter3: Functions
Section3.3: Rates Of Change And Behavior Of Graphs
Problem 26SE: Table 3 gives the annual sales (in millions of dollars) of a product from 1998 to 20006. What was...

Related questions
Question
What is the average rate of change?
Transcribed Image Text:Question 1
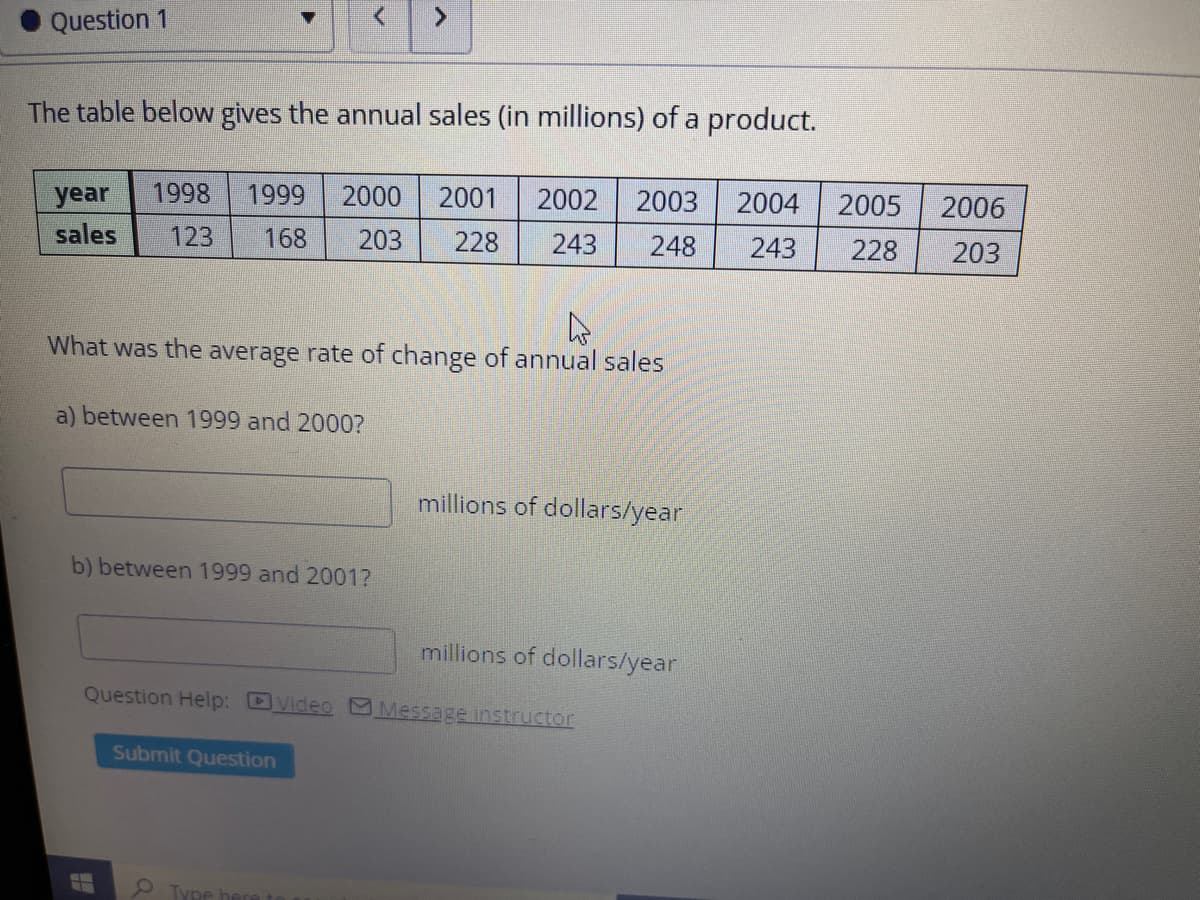
The table below gives the annual sales (in millions) of a product.
year
1998
1999
2000
2001
2002
2003
2004
2005
2006
sales
123
168
203
228
243
248
243
228
203
What was the average rate of change of annual sales
a) between 1999 and 2000?
millions of dollars/year
b) between 1999 and 2001?
millions of dollars/year
Question Help: DVideo Message instructor
Submit Question
9Type
Expert Solution
This question has been solved!
Explore an expertly crafted, step-by-step solution for a thorough understanding of key concepts.

This is a popular solution!

Trending now
This is a popular solution!

Step by step
Solved in 2 steps with 2 images

Recommended textbooks for you

Algebra & Trigonometry with Analytic Geometry
Algebra
ISBN:
9781133382119
Author:
Swokowski
Publisher:
Cengage

Functions and Change: A Modeling Approach to Coll…
Algebra
ISBN:
9781337111348
Author:
Bruce Crauder, Benny Evans, Alan Noell
Publisher:
Cengage Learning
Algebra & Trigonometry with Analytic Geometry
Algebra
ISBN:
9781133382119
Author:
Swokowski
Publisher:
Cengage
Functions and Change: A Modeling Approach to Coll…
Algebra
ISBN:
9781337111348
Author:
Bruce Crauder, Benny Evans, Alan Noell
Publisher:
Cengage Learning