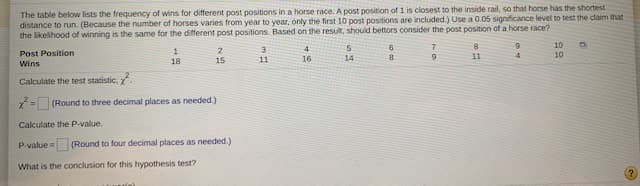
The table below lists the frequency of wins for different post positions in a horse race. A post position of 1 is closest to the inside ral, so thal ho distance to run. (Because the number of horses varies from year to year, only the first 10 post positions are included.) Use a 0.05 significance level to test the claim that the likelihood of winning is the same for the different post positions. Based on the resut, should bettors consider the post position of a horse race? 10 10 Post Position 1. 2 3. 18 15 11 16 14 11 Wins Calculate the test statistic. . (Round to three decimal places as needed.) Calculate the P-value. Pvalue (Round to four decimal places as needed.) What is the conclusion for this hypothesis test? 70


Addition Rule of Probability
It simply refers to the likelihood of an event taking place whenever the occurrence of an event is uncertain. The probability of a single event can be calculated by dividing the number of successful trials of that event by the total number of trials.
Expected Value
When a large number of trials are performed for any random variable ‘X’, the predicted result is most likely the mean of all the outcomes for the random variable and it is known as expected value also known as expectation. The expected value, also known as the expectation, is denoted by: E(X).
Probability Distributions
Understanding probability is necessary to know the probability distributions. In statistics, probability is how the uncertainty of an event is measured. This event can be anything. The most common examples include tossing a coin, rolling a die, or choosing a card. Each of these events has multiple possibilities. Every such possibility is measured with the help of probability. To be more precise, the probability is used for calculating the occurrence of events that may or may not happen. Probability does not give sure results. Unless the probability of any event is 1, the different outcomes may or may not happen in real life, regardless of how less or how more their probability is.
Basic Probability
The simple definition of probability it is a chance of the occurrence of an event. It is defined in numerical form and the probability value is between 0 to 1. The probability value 0 indicates that there is no chance of that event occurring and the probability value 1 indicates that the event will occur. Sum of the probability value must be 1. The probability value is never a negative number. If it happens, then recheck the calculation.

Step by step
Solved in 4 steps with 4 images


