The table below shows experimental values of two variables x and y which are related by the equation y = kx, where k and t are constants. 1.5 2 2.5 3 4.5 y 45 25 15.8 11 2.6 (1) Plot a straight line graph of Ig y against lg x. (ii) Use your graph to estimate the value of k and of t. (iii) On the same diagram, draw the line representing the equation y = x' and hence find the value of x for which x = k.
The table below shows experimental values of two variables x and y which are related by the equation y = kx, where k and t are constants. 1.5 2 2.5 3 4.5 y 45 25 15.8 11 2.6 (1) Plot a straight line graph of Ig y against lg x. (ii) Use your graph to estimate the value of k and of t. (iii) On the same diagram, draw the line representing the equation y = x' and hence find the value of x for which x = k.

Algebra & Trigonometry with Analytic Geometry
13th Edition
ISBN:9781133382119
Author:Swokowski
Publisher:Swokowski
Chapter7: Analytic Trigonometry
Section7.6: The Inverse Trigonometric Functions
Problem 93E

Related questions
Question
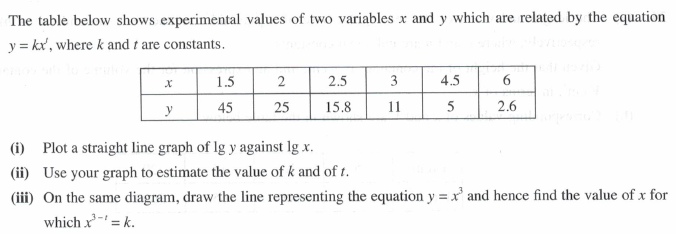
Transcribed Image Text:The table below shows experimental values of two variables x and y which are related by the equation
y = kx', where k and t are constants.
1.5
2
2.5
3
4.5
6
y
45
25
15.8
11
5
2.6
(i) Plot a straight line graph of lg y against lg x.
(ii) Use your graph to estimate the value of k and of t.
(iii) On the same diagram, draw the line representing the equation y = x' and hence find the value of x for
which x- = k.
Expert Solution
This question has been solved!
Explore an expertly crafted, step-by-step solution for a thorough understanding of key concepts.

This is a popular solution!

Trending now
This is a popular solution!

Step by step
Solved in 4 steps with 2 images

Recommended textbooks for you
Algebra & Trigonometry with Analytic Geometry
Algebra
ISBN:
9781133382119
Author:
Swokowski
Publisher:
Cengage
Algebra & Trigonometry with Analytic Geometry
Algebra
ISBN:
9781133382119
Author:
Swokowski
Publisher:
Cengage