The table below shows head length and breadth of siblings. The four variables are X₁= head length of first son, X₂ = head breadth of first son, X3 = head length of second son, and X₁ = head breadth of second son obtained from 25 families. Do first and second sons differ in their average head dimensions? State appropriate null hypothesis for this and test at a = 0.05 and interpret results. You may use softwares for computations but make sure to give (X₁-X3 and state Ho in terms of Y. all necessary details. Hint: Define Y (X₂-X₁) Table 1: Head dimension data from Frets (1921), measured on siblings in 25 families X₁ X3 191 179 195 201 185 188 171 192 190 189 197 187 179 181 183 176 208 189 197 188 192 186 179 195 202 194 163 195 186 181 175 192 174 176 197 190 X₂ 155 149 148 153 144 157 150 159 152 150 161 147 153 160 154 137 155 153 145 140 154 143 139 167 153 183 174 190 188 161 183 173 182 165 185 178 176 200 187 145 152 149 149 142 152 149 152 159 151 158 147 150 159 151 130 158 148 146 137 152 147 143 158 150
The table below shows head length and breadth of siblings. The four variables are X₁= head length of first son, X₂ = head breadth of first son, X3 = head length of second son, and X₁ = head breadth of second son obtained from 25 families. Do first and second sons differ in their average head dimensions? State appropriate null hypothesis for this and test at a = 0.05 and interpret results. You may use softwares for computations but make sure to give (X₁-X3 and state Ho in terms of Y. all necessary details. Hint: Define Y (X₂-X₁) Table 1: Head dimension data from Frets (1921), measured on siblings in 25 families X₁ X3 191 179 195 201 185 188 171 192 190 189 197 187 179 181 183 176 208 189 197 188 192 186 179 195 202 194 163 195 186 181 175 192 174 176 197 190 X₂ 155 149 148 153 144 157 150 159 152 150 161 147 153 160 154 137 155 153 145 140 154 143 139 167 153 183 174 190 188 161 183 173 182 165 185 178 176 200 187 145 152 149 149 142 152 149 152 159 151 158 147 150 159 151 130 158 148 146 137 152 147 143 158 150

Algebra & Trigonometry with Analytic Geometry
13th Edition
ISBN:9781133382119
Author:Swokowski
Publisher:Swokowski
Chapter10: Sequences, Series, And Probability
Section: Chapter Questions
Problem 27T

Related questions
Question
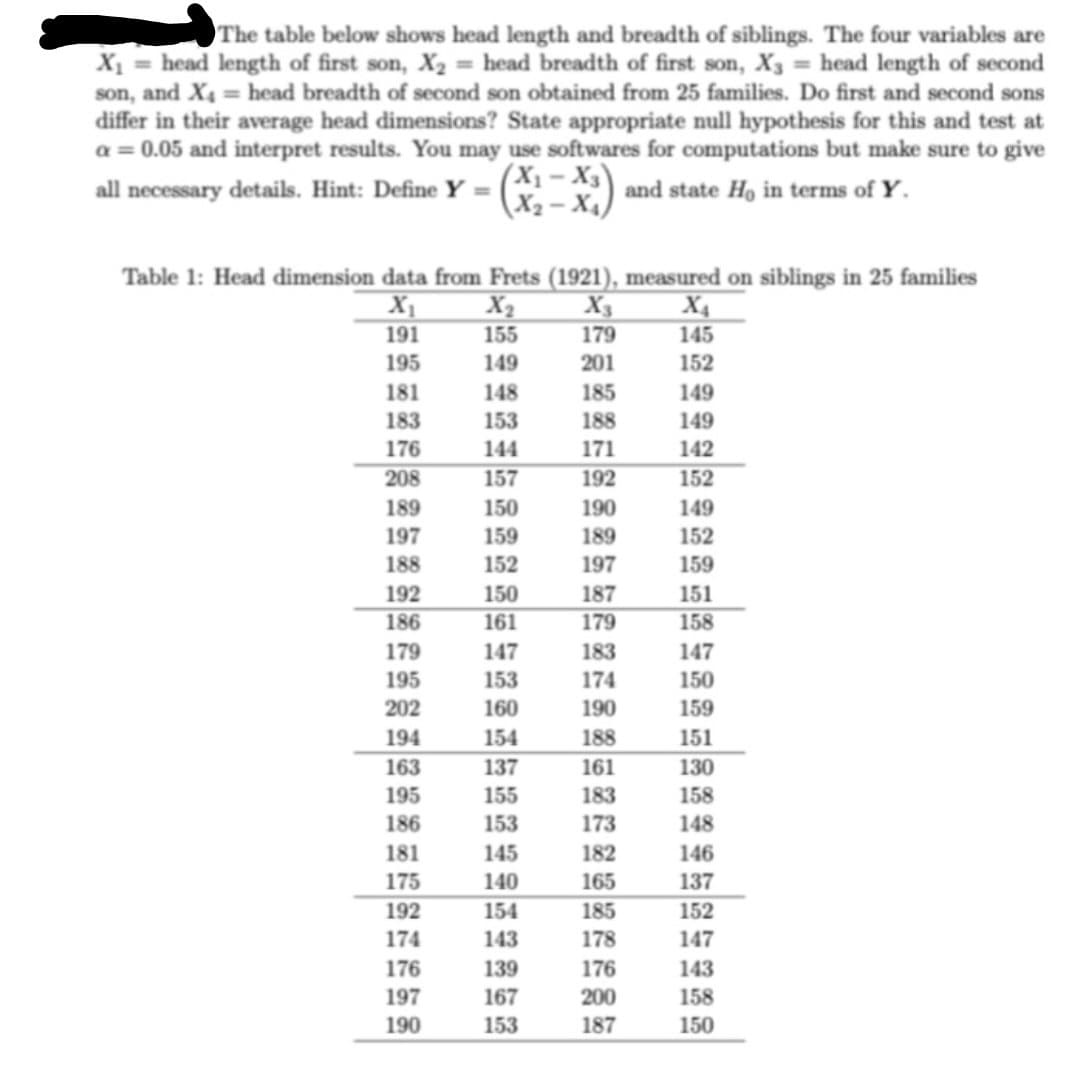
Transcribed Image Text:The table below shows head length and breadth of siblings. The four variables are
X₁ = head length of first son, X₂ = head breadth of first son, X3 = head length of second
son, and X₁ = head breadth of second son obtained from 25 families. Do first and second sons
differ in their average head dimensions? State appropriate null hypothesis for this and test at
a = 0.05 and interpret results. You may use softwares for computations but make sure to give
(X₁-X3)
all necessary details. Hint: Define Y =
and state Ho in terms of Y.
(X₂-X₁)
Table 1: Head dimension data from Frets (1921), measured on siblings in 25 families
X₁
X₂
191
155
195
149
181
183
176
208
189
197
188
192
186
179
195
202
194
163
195
186
181
175
192
174
176
197
190
148
153
144
157
150
159
152
150
161
147
153
160
154
137
155
153
145
140
154
143
139
167
153
X3
179
201
185
188
171
192
190
189
197
187
179
183
174
190
188
161
183
173
182
165
185
178
176
200
187
X4
145
152
149
149
142
152
149
152
159
151
158
147
150
159
151
130
158
148
146
137
152
147
143
158
150
Expert Solution
This question has been solved!
Explore an expertly crafted, step-by-step solution for a thorough understanding of key concepts.

Step by step
Solved in 3 steps with 3 images

Recommended textbooks for you
Algebra & Trigonometry with Analytic Geometry
Algebra
ISBN:
9781133382119
Author:
Swokowski
Publisher:
Cengage
Algebra & Trigonometry with Analytic Geometry
Algebra
ISBN:
9781133382119
Author:
Swokowski
Publisher:
Cengage