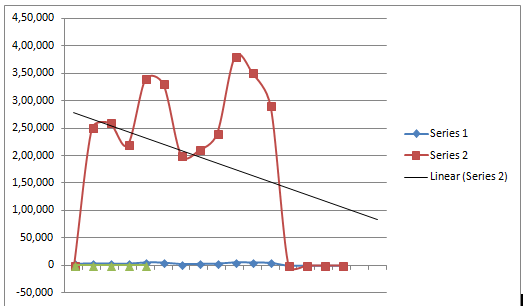
The table below shows monthly data collected on production costs and on the number of units produced over a twelve month period Month Total Production Cost Level of Activity (Units Produced) July $230,000 3,500 August 250,000 3,750 September 260,000 3,800 October 220,000 3,400 November 340,000 5,800 December 330,000 5,500 January 200,000 2,900 February 210,000 3,300 March 240,000 3,600 April 380,000 5,900 May 350,000 5,600 June 290,000 5,000 Varible cost per unit = $60.00 The total mixed cost equation The total mixed cost equation = y=a+bx y = $26,000 + $60x To solve the equation, total no. of units can be added at 'x' place. Scatter diagram attached. Showing Outliers a) Using the line of best-fit, determine the company’s fixed cost per month and the variable cost per unit. (Use 0 & 5,000 units.) b) In view of the department’s cost behaviour pattern, which of the two methods appear more appropriate? Explain your answer
The table below shows monthly data collected on production costs and on the number of units produced over a twelve month period Month Total Production Cost Level of Activity (Units Produced) July $230,000 3,500 August 250,000 3,750 September 260,000 3,800 October 220,000 3,400 November 340,000 5,800 December 330,000 5,500 January 200,000 2,900 February 210,000 3,300 March 240,000 3,600 April 380,000 5,900 May 350,000 5,600 June 290,000 5,000 Varible cost per unit = $60.00 The total mixed cost equation The total mixed cost equation = y=a+bx y = $26,000 + $60x To solve the equation, total no. of units can be added at 'x' place. Scatter diagram attached. Showing Outliers a) Using the line of best-fit, determine the company’s fixed cost per month and the variable cost per unit. (Use 0 & 5,000 units.) b) In view of the department’s cost behaviour pattern, which of the two methods appear more appropriate? Explain your answer

Chapter1: Financial Statements And Business Decisions
Section: Chapter Questions
Problem 1Q

Related questions

Question
The table below shows monthly data collected on production costs and on the number of
units produced over a twelve month period
| Month | Total Production Cost | Level of Activity (Units Produced) |
| July | $230,000 | 3,500 |
| August | 250,000 | 3,750 |
| September | 260,000 | 3,800 |
| October | 220,000 | 3,400 |
| November | 340,000 | 5,800 |
| December | 330,000 | 5,500 |
| January | 200,000 | 2,900 |
| February | 210,000 | 3,300 |
| March | 240,000 | 3,600 |
| April | 380,000 | 5,900 |
| May | 350,000 | 5,600 |
| June | 290,000 | 5,000 |
Varible cost per unit = $60.00
The total mixed cost equation
The total mixed cost equation = y=a+bx
y = $26,000 + $60x
To solve the equation, total no. of units can be added at 'x' place.
Scatter diagram attached. Showing Outliers
a) Using the line of best-fit, determine the company’s fixed cost
per month and the
variable cost per unit. (Use 0 & 5,000 units.)
b) In view of the department’s cost behaviour pattern, which of the two methods
appear more appropriate? Explain your answer
Transcribed Image Text:4,50,000
4,00,000
3,50,000
3,00,000
2,50,000
Series 1
2,00,000
-Series 2
Linear (Series 2)
1,50,000
1,00,000
50,000
-50,000
Expert Solution
This question has been solved!
Explore an expertly crafted, step-by-step solution for a thorough understanding of key concepts.

This is a popular solution!

Trending now
This is a popular solution!

Step by step
Solved in 2 steps with 2 images

Knowledge Booster


Learn more about
Need a deep-dive on the concept behind this application? Look no further. Learn more about this topic, accounting and related others by exploring similar questions and additional content below.Recommended textbooks for you

Accounting
Accounting
ISBN:
9781337272094
Author:
WARREN, Carl S., Reeve, James M., Duchac, Jonathan E.
Publisher:
Cengage Learning,

Accounting Information Systems
Accounting
ISBN:
9781337619202
Author:
Hall, James A.
Publisher:
Cengage Learning,
Accounting
Accounting
ISBN:
9781337272094
Author:
WARREN, Carl S., Reeve, James M., Duchac, Jonathan E.
Publisher:
Cengage Learning,
Accounting Information Systems
Accounting
ISBN:
9781337619202
Author:
Hall, James A.
Publisher:
Cengage Learning,

Horngren's Cost Accounting: A Managerial Emphasis…
Accounting
ISBN:
9780134475585
Author:
Srikant M. Datar, Madhav V. Rajan
Publisher:
PEARSON

Intermediate Accounting
Accounting
ISBN:
9781259722660
Author:
J. David Spiceland, Mark W. Nelson, Wayne M Thomas
Publisher:
McGraw-Hill Education

Financial and Managerial Accounting
Accounting
ISBN:
9781259726705
Author:
John J Wild, Ken W. Shaw, Barbara Chiappetta Fundamental Accounting Principles
Publisher:
McGraw-Hill Education