The table below shows relative frequency distribution for 50 employees working in a small construction company classified according to their years of experience, the approximate value * :of variance is Years of Relative Frequency of experience Employees 5-10 0.3 11-16 0.4 17-22 0.2 23-28 0.1
The table below shows relative frequency distribution for 50 employees working in a small construction company classified according to their years of experience, the approximate value * :of variance is Years of Relative Frequency of experience Employees 5-10 0.3 11-16 0.4 17-22 0.2 23-28 0.1

Glencoe Algebra 1, Student Edition, 9780079039897, 0079039898, 2018
18th Edition
ISBN:9780079039897
Author:Carter
Publisher:Carter
Chapter10: Statistics
Section10.4: Distributions Of Data
Problem 3GP

Related questions
Question
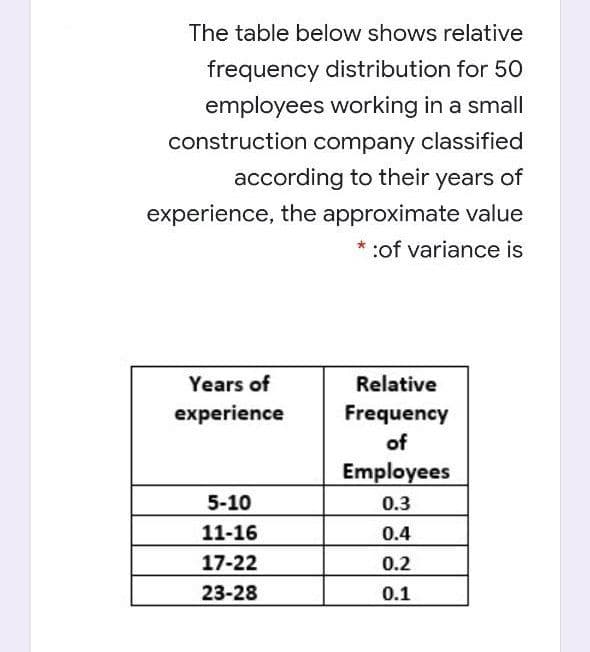
Transcribed Image Text:The table below shows relative
frequency distribution for 50
employees working in a small
construction company classified
according to their years of
experience, the approximate value
* :of variance is
Years of
Relative
experience
Frequency
of
Employees
5-10
0.3
0.4
11-16
17-22
0.2
23-28
0.1
Expert Solution
This question has been solved!
Explore an expertly crafted, step-by-step solution for a thorough understanding of key concepts.

Step by step
Solved in 2 steps with 2 images

Recommended textbooks for you
Glencoe Algebra 1, Student Edition, 9780079039897…
Algebra
ISBN:
9780079039897
Author:
Carter
Publisher:
McGraw Hill
Glencoe Algebra 1, Student Edition, 9780079039897…
Algebra
ISBN:
9780079039897
Author:
Carter
Publisher:
McGraw Hill