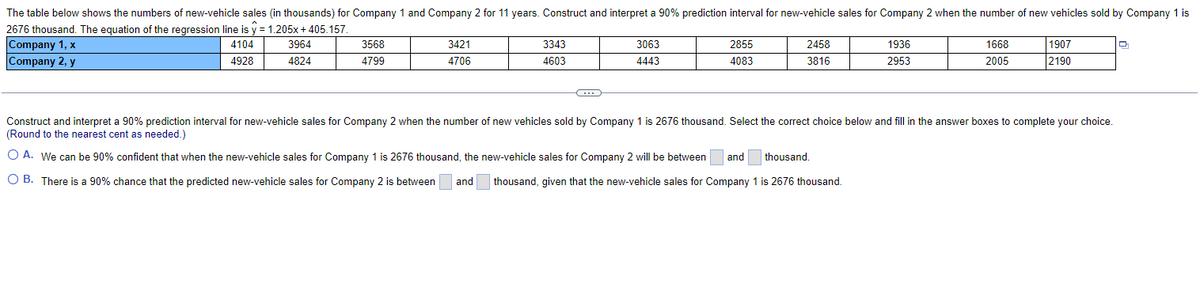
The table below shows the numbers of new-vehicle sales (in thousands) for Company 1 and Company 2 for 11 years. Construct and interpret a 90% prediction interval for new-vehicle sales for Company 2 when the number of new vehicles sold by Company 1 is 2676 thousand. The equation of the regression line is y = 1.205x+ 405.157. Company 1, x Company 2, y | 1907 2190 4104 3964 3568 3421 3343 3063 2855 2458 1936 1668 4928 4824 4799 4706 4603 4443 4083 3816 2953 2005 when the number of new vehicles sold by Company 1 is 2676 thousand. Select the correct choice below and fill in the answer boxes to complete your choice. Construct and interpret a 90% prediction interval for new-vehicle sales for Company (Round to the nearest cent needed.) O A. We can be 90% confident that when the new-vehicle sales for Company 1 is 2676 thousand, the new-vehicle sales for Company 2 will be between and thousand. O B. There is a 90% chance that the predicted new-vehicle sales for Company 2 is between and thousand, given that the new-vehicle sales for Company 1 is 2676 thousand.
The table below shows the numbers of new-vehicle sales (in thousands) for Company 1 and Company 2 for 11 years. Construct and interpret a 90% prediction interval for new-vehicle sales for Company 2 when the number of new vehicles sold by Company 1 is 2676 thousand. The equation of the regression line is y = 1.205x+ 405.157. Company 1, x Company 2, y | 1907 2190 4104 3964 3568 3421 3343 3063 2855 2458 1936 1668 4928 4824 4799 4706 4603 4443 4083 3816 2953 2005 when the number of new vehicles sold by Company 1 is 2676 thousand. Select the correct choice below and fill in the answer boxes to complete your choice. Construct and interpret a 90% prediction interval for new-vehicle sales for Company (Round to the nearest cent needed.) O A. We can be 90% confident that when the new-vehicle sales for Company 1 is 2676 thousand, the new-vehicle sales for Company 2 will be between and thousand. O B. There is a 90% chance that the predicted new-vehicle sales for Company 2 is between and thousand, given that the new-vehicle sales for Company 1 is 2676 thousand.

College Algebra
7th Edition
ISBN:9781305115545
Author:James Stewart, Lothar Redlin, Saleem Watson
Publisher:James Stewart, Lothar Redlin, Saleem Watson
Chapter1: Equations And Graphs
Section: Chapter Questions
Problem 10T: Olympic Pole Vault The graph in Figure 7 indicates that in recent years the winning Olympic men’s...

Related questions
Question
Transcribed Image Text:The table below shows the numbers of new-vehicle sales (in thousands) for Company 1 and Company 2 for 11 years. Construct and interpret a 90% prediction interval for new-vehicle sales for Company 2 when the number of new vehicles sold by Company 1 is
2676 thousand. The equation of the regression line is y = 1.205x + 405.157.
Company 1, x
Company 2, y
1907
2190
4104
3964
3568
3421
3343
3063
2855
2458
1936
1668
4928
4824
4799
4706
4603
4443
4083
3816
2953
2005
Construct and interpret a 90% prediction interval for new-vehicle sales for Company 2 when the number of new vehicles sold by Company 1 is 2676 thousand. Select the correct choice below and fill in the answer boxes to complete your choice.
(Round to the nearest cent as needed.)
O A. We can be 90% confident that when the new-vehicle sales for Company 1 is 2676 thousand, the new-vehicle sales for Company 2 will be between
and
thousand.
O B. There is a 90% chance that the predicted new-vehicle sales for Company 2 is between
and
thousand, given that the new-vehicle sales for Company 1 is 2676 thousand.
Expert Solution
This question has been solved!
Explore an expertly crafted, step-by-step solution for a thorough understanding of key concepts.

This is a popular solution!

Trending now
This is a popular solution!

Step by step
Solved in 3 steps with 3 images

Recommended textbooks for you
College Algebra
Algebra
ISBN:
9781305115545
Author:
James Stewart, Lothar Redlin, Saleem Watson
Publisher:
Cengage Learning

Linear Algebra: A Modern Introduction
Algebra
ISBN:
9781285463247
Author:
David Poole
Publisher:
Cengage Learning

Functions and Change: A Modeling Approach to Coll…
Algebra
ISBN:
9781337111348
Author:
Bruce Crauder, Benny Evans, Alan Noell
Publisher:
Cengage Learning
College Algebra
Algebra
ISBN:
9781305115545
Author:
James Stewart, Lothar Redlin, Saleem Watson
Publisher:
Cengage Learning
Linear Algebra: A Modern Introduction
Algebra
ISBN:
9781285463247
Author:
David Poole
Publisher:
Cengage Learning
Functions and Change: A Modeling Approach to Coll…
Algebra
ISBN:
9781337111348
Author:
Bruce Crauder, Benny Evans, Alan Noell
Publisher:
Cengage Learning