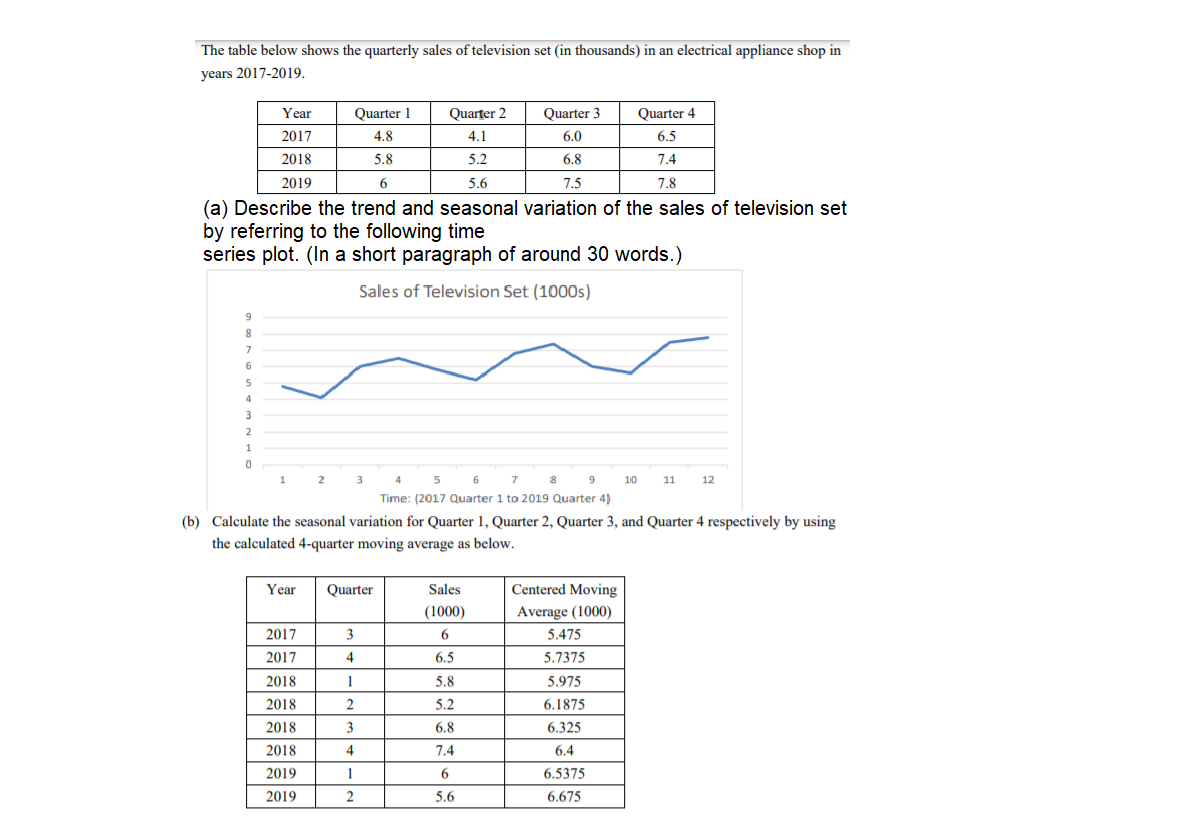
The table below shows the quarterly sales of television set (in thousands) in an electrical appliance shop in years 2017-2019. Year Quarter 1 Quarter 2 Quarter 3 Quarter 4 2017 4.8 4.1 6.0 6.5 2018 5.8 5.2 6.8 7.4 2019 5.6 7.5 7.8 (a) Describe the trend and seasonal variation of the sales of television set by referring to the following time series plot. (In a short paragraph of around 30 words.) Sales of Television Set (1000s) 7 6 5 4 2 1 7 10 11 12 Time: (2017 Quarter 1 to 2019 Quarter 4) (b) Calculate the seasonal variation for Quarter 1, Quarter 2, Quarter 3, and Quarter 4 respectively by using the calculated 4-quarter moving average as below. Year Quarter Sales Centered Moving (1000) Average (1000) 2017 3 5.475 2017 4 6.5 5.7375 2018 1 5.8 5.975 2018 2 5.2 6.1875 2018 3 6.8 6.325 2018 4 7.4 6.4 2019 1 6.5375
The table below shows the quarterly sales of television set (in thousands) in an electrical appliance shop in years 2017-2019. Year Quarter 1 Quarter 2 Quarter 3 Quarter 4 2017 4.8 4.1 6.0 6.5 2018 5.8 5.2 6.8 7.4 2019 5.6 7.5 7.8 (a) Describe the trend and seasonal variation of the sales of television set by referring to the following time series plot. (In a short paragraph of around 30 words.) Sales of Television Set (1000s) 7 6 5 4 2 1 7 10 11 12 Time: (2017 Quarter 1 to 2019 Quarter 4) (b) Calculate the seasonal variation for Quarter 1, Quarter 2, Quarter 3, and Quarter 4 respectively by using the calculated 4-quarter moving average as below. Year Quarter Sales Centered Moving (1000) Average (1000) 2017 3 5.475 2017 4 6.5 5.7375 2018 1 5.8 5.975 2018 2 5.2 6.1875 2018 3 6.8 6.325 2018 4 7.4 6.4 2019 1 6.5375

Practical Management Science
6th Edition
ISBN:9781337406659
Author:WINSTON, Wayne L.
Publisher:WINSTON, Wayne L.
Chapter13: Regression And Forecasting Models
Section13.6: Moving Averages Models
Problem 19P: The file P13_19.xlsx contains the weekly sales of a particular brand of paper towels at a...

Related questions
Question
Transcribed Image Text:The table below shows the quarterly sales of television set (in thousands) in an electrical appliance shop in
years 2017-2019.
Year
Quarter 1
Quarter 2
Quarter 3
Quarter 4
2017
4.8
4.1
6.0
6.5
2018
5.8
5.2
6.8
7.4
2019
6.
5.6
7,5
7.8
(a) Describe the trend and seasonal variation of the sales of television set
by referring to the following time
series plot. (In a short paragraph of around 30 words.)
Sales of Television Set (1000s)
2
3
5
8
9
10
11
12
Time: (2017 Quarter 1 to 2019 Quarter 4)
(b) Calculate the seasonal variation for Quarter 1, Quarter 2, Quarter 3, and Quarter 4 respectively by using
the calculated 4-quarter moving average as below.
Year
Quarter
Sales
Centered Moving
(1000)
Average (1000)
2017
5.475
2017
4
6.5
5.7375
2018
1
5.8
5.975
2018
2
5.2
6.1875
2018
3
6.8
6.325
2018
7.4
6.4
2019
1
6
6.5375
2019
2
5.6
6.675
TTTT"
Expert Solution
This question has been solved!
Explore an expertly crafted, step-by-step solution for a thorough understanding of key concepts.

This is a popular solution!

Trending now
This is a popular solution!

Step by step
Solved in 2 steps

Recommended textbooks for you
Practical Management Science
Operations Management
ISBN:
9781337406659
Author:
WINSTON, Wayne L.
Publisher:
Cengage,
Practical Management Science
Operations Management
ISBN:
9781337406659
Author:
WINSTON, Wayne L.
Publisher:
Cengage,