The table below shows the summary statistics of two variables for correlation analysis. Descriptive Statistics Weight at birth (Kilograms) Age of woman Mean 3.58592 27.04 Std. Deviation 1.830438 6.467 510 510 Note that the sample sizes are both given as 510 even though this is not necessarily the case. Which one of the following is the likely and logical explanation for using 510? O a. There are exactly 510 cases where data is available for both woman age and baby's birthweight O b. SPSS used the sample size calculator to determine the value 510 OC. SPSS extracted 510 cases which did not violate any assumptions for correlation analysis. O d. 510 is a large enough sample and there is no need using more data
The table below shows the summary statistics of two variables for correlation analysis. Descriptive Statistics Weight at birth (Kilograms) Age of woman Mean 3.58592 27.04 Std. Deviation 1.830438 6.467 510 510 Note that the sample sizes are both given as 510 even though this is not necessarily the case. Which one of the following is the likely and logical explanation for using 510? O a. There are exactly 510 cases where data is available for both woman age and baby's birthweight O b. SPSS used the sample size calculator to determine the value 510 OC. SPSS extracted 510 cases which did not violate any assumptions for correlation analysis. O d. 510 is a large enough sample and there is no need using more data

Glencoe Algebra 1, Student Edition, 9780079039897, 0079039898, 2018
18th Edition
ISBN:9780079039897
Author:Carter
Publisher:Carter
Chapter10: Statistics
Section10.4: Distributions Of Data
Problem 19PFA

Related questions
Question
Descriptive stats
Transcribed Image Text:7
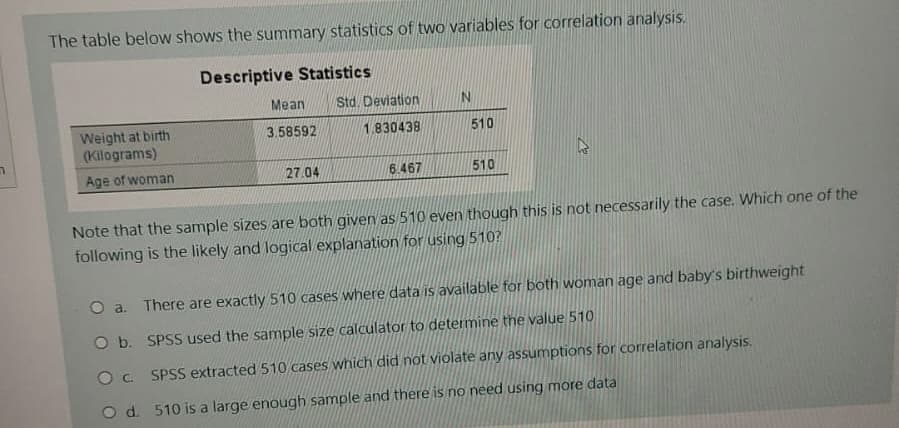
The table below shows the summary statistics of two variables for correlation analysis.
Descriptive Statistics
Weight at birth
(Kilograms)
Age of woman
Mean
3.58592
27.04
Std. Deviation
1.830438
6.467
N
510
510
A
Note that the sample sizes are both given as 510 even though this is not necessarily the case. Which one of the
following is the likely and logical explanation for using 510?
O a. There are exactly 510 cases where data is available for both woman age and baby's birthweight
O b.
SPSS used the sample size calculator to determine the value 510
OC. SPSS extracted 510 cases which did not violate any assumptions for correlation analysis.
O d. 510 is a large enough sample and there is no need using more data
Expert Solution
This question has been solved!
Explore an expertly crafted, step-by-step solution for a thorough understanding of key concepts.

Step by step
Solved in 2 steps

Recommended textbooks for you
Glencoe Algebra 1, Student Edition, 9780079039897…
Algebra
ISBN:
9780079039897
Author:
Carter
Publisher:
McGraw Hill
Glencoe Algebra 1, Student Edition, 9780079039897…
Algebra
ISBN:
9780079039897
Author:
Carter
Publisher:
McGraw Hill