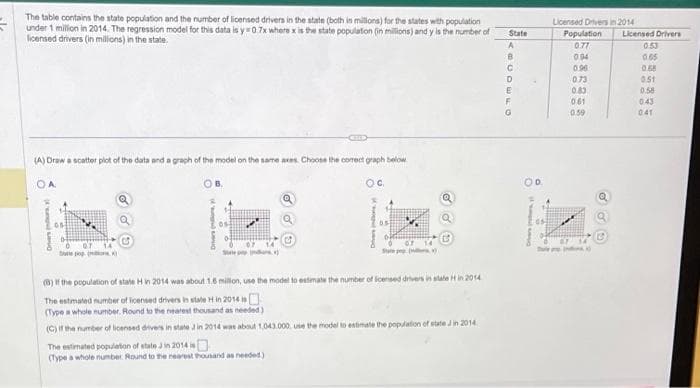
The table contains the state population and the number of licensed drivers in the state (both in millions) for the states with population under 1 million in 2014. The regression model for this data is y 0.7x where x is the state population (in millions) and y is the number of licensed drivers (in millions) in the state. (A) Draw a scatter plot of the data and a graph of the model on the same axes. Choose the corect graph below w pop 05 C₁ (8) If the population of state H in 2014 was about 1.6 millon, use the model to estimate the number of licensed drivers in state H in 2014 The estimated number of licensed drivers in state H in 2014 is (Type a whole number. Round to the nearest thousand as needed) (C) If the number of licensed drivers in state J in 2014 was about 1,043.000, use the model to estimate the population of state J in 2014 The estimated population of state J in 2014 is (Type a whole number Round to the nearest thousand as needed) State A 8 C 0930 8 Licensed Drivers in 2014 Population 0.77 0.04 0.90 0.73 0.83 061 0.59 67 34 (C Licensed Drivers 0.53 0.05 0.68 0.51 0.58 043 041
The table contains the state population and the number of licensed drivers in the state (both in millions) for the states with population under 1 million in 2014. The regression model for this data is y 0.7x where x is the state population (in millions) and y is the number of licensed drivers (in millions) in the state. (A) Draw a scatter plot of the data and a graph of the model on the same axes. Choose the corect graph below w pop 05 C₁ (8) If the population of state H in 2014 was about 1.6 millon, use the model to estimate the number of licensed drivers in state H in 2014 The estimated number of licensed drivers in state H in 2014 is (Type a whole number. Round to the nearest thousand as needed) (C) If the number of licensed drivers in state J in 2014 was about 1,043.000, use the model to estimate the population of state J in 2014 The estimated population of state J in 2014 is (Type a whole number Round to the nearest thousand as needed) State A 8 C 0930 8 Licensed Drivers in 2014 Population 0.77 0.04 0.90 0.73 0.83 061 0.59 67 34 (C Licensed Drivers 0.53 0.05 0.68 0.51 0.58 043 041

Algebra and Trigonometry (MindTap Course List)
4th Edition
ISBN:9781305071742
Author:James Stewart, Lothar Redlin, Saleem Watson
Publisher:James Stewart, Lothar Redlin, Saleem Watson
Chapter1: Equations And Graphs
Section1.FOM: Focus On Modeling: Fitting Lines To Data
Problem 6P

Related questions
Question
Transcribed Image Text:#
The table contains the state population and the number of licensed drivers in the state (both in millions) for the states with population
under 1 million in 2014. The regression model for this data is y 0.7x where x is the state population (in millions) and y is the number of State
licensed drivers (in millions) in the state.
(A) Draw a scatter plot of the data and a graph of the model on the same axes. Choose the correct graph below
OC
Diverse)
07
Se pun
CHANG
The estimated population of state Jin 2014 is
(Type a whole number Round to the nearest thousand as needed)
0.5
(8) If the population of state H in 2014 was about 1.6 million, use the model to estimate the number of licensed drivers in state H in 2014
The estimated number of licensed drivers in state H in 2014 is
(Type a whole number. Round to the nearest thousand as needed)
(C) If the number of licensed drivers in state J in 2014 was about 1,043.000, use the model to estimate the population of state Jin 2014
AOCDEFO
А
С
OD
Licensed Drivers in 2014
Population
0.77
IN
0.94
0.96
0.73
0.83
061
0.59
Licensed Drivers
0.53
065
0.88
0.51
0.58
0:43
041
Expert Solution
This question has been solved!
Explore an expertly crafted, step-by-step solution for a thorough understanding of key concepts.

This is a popular solution!

Trending now
This is a popular solution!

Step by step
Solved in 4 steps with 3 images

Recommended textbooks for you
Algebra and Trigonometry (MindTap Course List)
Algebra
ISBN:
9781305071742
Author:
James Stewart, Lothar Redlin, Saleem Watson
Publisher:
Cengage Learning

Algebra & Trigonometry with Analytic Geometry
Algebra
ISBN:
9781133382119
Author:
Swokowski
Publisher:
Cengage

Big Ideas Math A Bridge To Success Algebra 1: Stu…
Algebra
ISBN:
9781680331141
Author:
HOUGHTON MIFFLIN HARCOURT
Publisher:
Houghton Mifflin Harcourt
Algebra and Trigonometry (MindTap Course List)
Algebra
ISBN:
9781305071742
Author:
James Stewart, Lothar Redlin, Saleem Watson
Publisher:
Cengage Learning
Algebra & Trigonometry with Analytic Geometry
Algebra
ISBN:
9781133382119
Author:
Swokowski
Publisher:
Cengage
Big Ideas Math A Bridge To Success Algebra 1: Stu…
Algebra
ISBN:
9781680331141
Author:
HOUGHTON MIFFLIN HARCOURT
Publisher:
Houghton Mifflin Harcourt


Glencoe Algebra 1, Student Edition, 9780079039897…
Algebra
ISBN:
9780079039897
Author:
Carter
Publisher:
McGraw Hill

Functions and Change: A Modeling Approach to Coll…
Algebra
ISBN:
9781337111348
Author:
Bruce Crauder, Benny Evans, Alan Noell
Publisher:
Cengage Learning