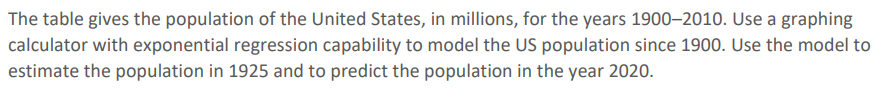
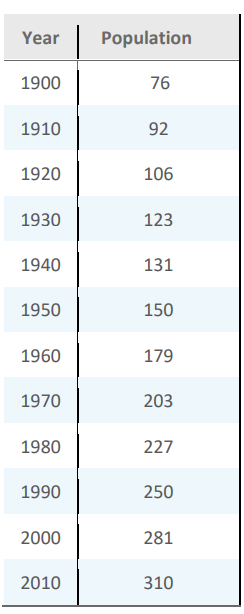
The table gives the population of the United States, in millions, for the years 1900–2010. Use a graphing calculator with exponential regression capability to model the US population since 1900. Use the model to estimate the population in 1925 and to predict the population in the year 2020.
The table gives the population of the United States, in millions, for the years 1900–2010. Use a graphing calculator with exponential regression capability to model the US population since 1900. Use the model to estimate the population in 1925 and to predict the population in the year 2020.

Chapter6: Exponential And Logarithmic Functions
Section6.8: Fitting Exponential Models To Data
Problem 1TI: Table 2 shows a recent graduate’s credit card balance each month after graduation. a. Use...

Related questions

Question
100%
Transcribed Image Text:The table gives the population of the United States, in millions, for the years 1900–2010. Use a graphing
calculator with exponential regression capability to model the US population since 1900. Use the model to
estimate the population in 1925 and to predict the population in the year 2020.
Transcribed Image Text:Year
Population
1900
76
1910
92
1920
106
1930
123
1940
131
1950
150
1960
179
1970
203
1980
227
1990
250
2000
281
2010
310
Expert Solution
This question has been solved!
Explore an expertly crafted, step-by-step solution for a thorough understanding of key concepts.

This is a popular solution!

Trending now
This is a popular solution!

Step by step
Solved in 2 steps with 2 images

Knowledge Booster


Learn more about
Need a deep-dive on the concept behind this application? Look no further. Learn more about this topic, calculus and related others by exploring similar questions and additional content below.Recommended textbooks for you

Algebra & Trigonometry with Analytic Geometry
Algebra
ISBN:
9781133382119
Author:
Swokowski
Publisher:
Cengage

Linear Algebra: A Modern Introduction
Algebra
ISBN:
9781285463247
Author:
David Poole
Publisher:
Cengage Learning
Algebra & Trigonometry with Analytic Geometry
Algebra
ISBN:
9781133382119
Author:
Swokowski
Publisher:
Cengage
Linear Algebra: A Modern Introduction
Algebra
ISBN:
9781285463247
Author:
David Poole
Publisher:
Cengage Learning

Trigonometry (MindTap Course List)
Trigonometry
ISBN:
9781337278461
Author:
Ron Larson
Publisher:
Cengage Learning
