The data in the table below represents the percentage of patients who have survived after diagnosis of advanced-stage breast cancer at 6-month intervals of time. (a) Using a graphing utility, build an exponential model from the data.
The data in the table below represents the percentage of patients who have survived after diagnosis of advanced-stage breast cancer at 6-month intervals of time. (a) Using a graphing utility, build an exponential model from the data.

Chapter6: Exponential And Logarithmic Functions
Section6.8: Fitting Exponential Models To Data
Problem 1TI: Table 2 shows a recent graduate’s credit card balance each month after graduation. a. Use...

Related questions
Question
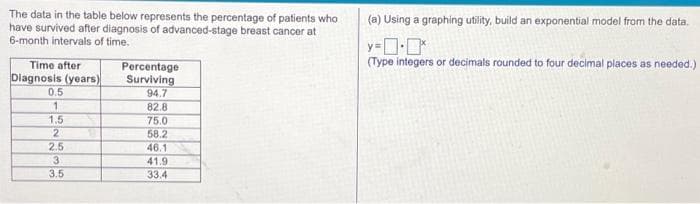
Transcribed Image Text:The data in the table below represents the percentage of patients who
have survived after diagnosis of advanced-stage breast cancer at
6-month intervals of time.
(a) Using a graphing utility, build an exponential model from the data.
(Type integers or decimals rounded to four decimal places as needed.)
Percentage
Surviving
Time after
Diagnosis (years)
0.5
94.7
1.
1.5
2
82.8
75.0
58.2
2.5
46.1
3
3.5
41.9
33.4
Expert Solution
This question has been solved!
Explore an expertly crafted, step-by-step solution for a thorough understanding of key concepts.

This is a popular solution!

Trending now
This is a popular solution!

Step by step
Solved in 3 steps with 2 images

Recommended textbooks for you

College Algebra
Algebra
ISBN:
9781305115545
Author:
James Stewart, Lothar Redlin, Saleem Watson
Publisher:
Cengage Learning

Algebra & Trigonometry with Analytic Geometry
Algebra
ISBN:
9781133382119
Author:
Swokowski
Publisher:
Cengage
College Algebra
Algebra
ISBN:
9781305115545
Author:
James Stewart, Lothar Redlin, Saleem Watson
Publisher:
Cengage Learning
Algebra & Trigonometry with Analytic Geometry
Algebra
ISBN:
9781133382119
Author:
Swokowski
Publisher:
Cengage

Functions and Change: A Modeling Approach to Coll…
Algebra
ISBN:
9781337111348
Author:
Bruce Crauder, Benny Evans, Alan Noell
Publisher:
Cengage Learning

Glencoe Algebra 1, Student Edition, 9780079039897…
Algebra
ISBN:
9780079039897
Author:
Carter
Publisher:
McGraw Hill

College Algebra (MindTap Course List)
Algebra
ISBN:
9781305652231
Author:
R. David Gustafson, Jeff Hughes
Publisher:
Cengage Learning