The table shows the annual compensation of 40 randomly chosen CEOs (millions of dollars). 5.32 1.90 23.67 8.66 14.01 6.67 3.14 4.13 192.46 19.07 26.40 7.65 12.11 14.75 1.89 6.07 82.68 14.15 24.93 5.59 9.60 4.26 1.46 3.43 22.60 16.66 19.26 5.62 7.06 2.47 0.57 3.38 35.86 13.01 22.79 6.52 8.48 4.63 1.34 4.23 A. Select the correct histogram for the above (see attached) B. Describe the shape of the histogram The distribution is skewed to the left. The distribution is skewed to the right. The distribution is symmetric. C. Identify any unusual values
The table shows the annual compensation of 40 randomly chosen CEOs (millions of dollars). 5.32 1.90 23.67 8.66 14.01 6.67 3.14 4.13 192.46 19.07 26.40 7.65 12.11 14.75 1.89 6.07 82.68 14.15 24.93 5.59 9.60 4.26 1.46 3.43 22.60 16.66 19.26 5.62 7.06 2.47 0.57 3.38 35.86 13.01 22.79 6.52 8.48 4.63 1.34 4.23 A. Select the correct histogram for the above (see attached) B. Describe the shape of the histogram The distribution is skewed to the left. The distribution is skewed to the right. The distribution is symmetric. C. Identify any unusual values

Functions and Change: A Modeling Approach to College Algebra (MindTap Course List)
6th Edition
ISBN:9781337111348
Author:Bruce Crauder, Benny Evans, Alan Noell
Publisher:Bruce Crauder, Benny Evans, Alan Noell
Chapter5: A Survey Of Other Common Functions
Section5.3: Modeling Data With Power Functions
Problem 6E: Urban Travel Times Population of cities and driving times are related, as shown in the accompanying...

Related questions
Question
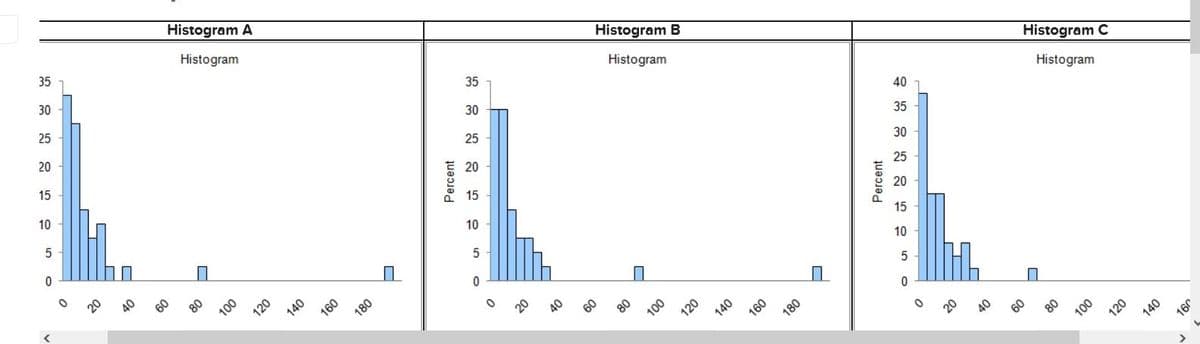
The table shows the annual compensation of 40 randomly chosen CEOs (millions of dollars).
| 5.32 | 1.90 | 23.67 | 8.66 | 14.01 | 6.67 | 3.14 | 4.13 |
| 192.46 | 19.07 | 26.40 | 7.65 | 12.11 | 14.75 | 1.89 | 6.07 |
| 82.68 | 14.15 | 24.93 | 5.59 | 9.60 | 4.26 | 1.46 | 3.43 |
| 22.60 | 16.66 | 19.26 | 5.62 | 7.06 | 2.47 | 0.57 | 3.38 |
| 35.86 | 13.01 | 22.79 | 6.52 | 8.48 | 4.63 | 1.34 | 4.23 |
A. Select the correct histogram for the above (see attached)
B. Describe the shape of the histogram
-
The distribution is skewed to the left.
-
The distribution is skewed to the right.
-
The distribution is symmetric.C. Identify any unusual values
Transcribed Image Text:35
30
25
20
15
10
5
0
Histogram A
Histogram
80
100
120
140
160
180
Percent
35
30
25
20
15
10
5
0
Histogram B
Histogram
80
100
120
140
160
180
Percent
40
35
30
25
20
15
10
5
0
O
H
Histogram C
Histogram
80
100
120
140
J9L
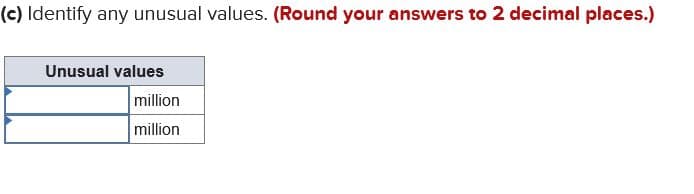
Transcribed Image Text:(c) Identify any unusual values. (Round your answers to 2 decimal places.)
Unusual values
million
million
Expert Solution
This question has been solved!
Explore an expertly crafted, step-by-step solution for a thorough understanding of key concepts.

This is a popular solution!

Trending now
This is a popular solution!

Step by step
Solved in 5 steps with 2 images

Recommended textbooks for you
Functions and Change: A Modeling Approach to Coll…
Algebra
ISBN:
9781337111348
Author:
Bruce Crauder, Benny Evans, Alan Noell
Publisher:
Cengage Learning

Glencoe Algebra 1, Student Edition, 9780079039897…
Algebra
ISBN:
9780079039897
Author:
Carter
Publisher:
McGraw Hill
Functions and Change: A Modeling Approach to Coll…
Algebra
ISBN:
9781337111348
Author:
Bruce Crauder, Benny Evans, Alan Noell
Publisher:
Cengage Learning
Glencoe Algebra 1, Student Edition, 9780079039897…
Algebra
ISBN:
9780079039897
Author:
Carter
Publisher:
McGraw Hill