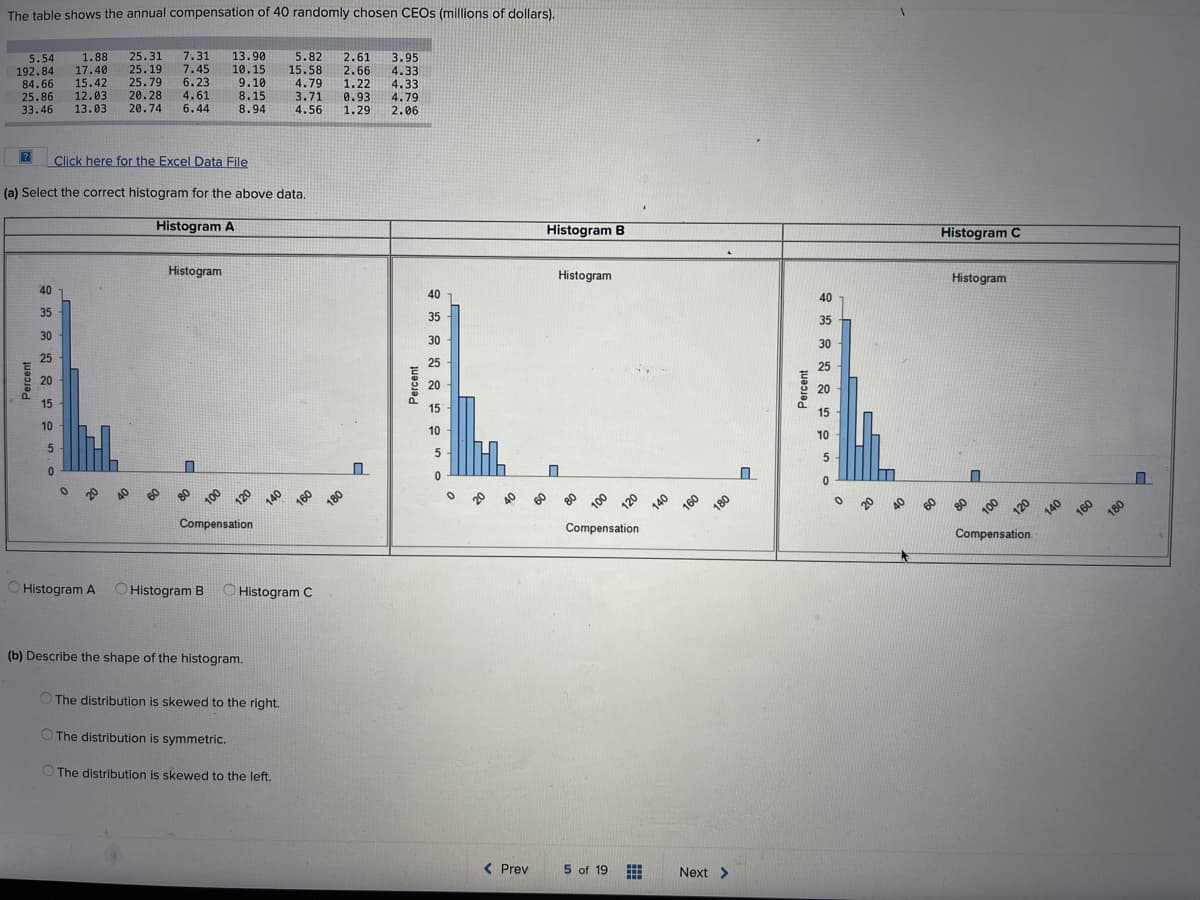
The table shows the annual compensation of 40 randomly chosen CEOS (millions of dollars). 5.54 192.84 84.66 25.86 33.46 25.31 1.88 17.40 15.42 12.03 13.03 7.31 13.90 10.15 5.82 25.19 25.79 2.61 2.66 1.22 0.93 1.29 3.95 7.45 6.23 4.61 6.44 15.58 4.79 3.71 4.56 9.10 4.33 20.28 20.74 8.15 8.94 4.33 4.79 2.06 2 Click here for the Excel Data File (a) Select the correct histogram for the above data, Histogram A Histogram B Histogram 40 Histogram C Histogram 35 40 1 30 35 Histogram 40 25 30 35 20 25 30 15 20 25 10 15 20 10 10 100 120 180 Compensation 120 140 160 Compensation 120 160 O Histogram A 180 O Histogram B O Histogram C Compensation (b) Describe the shape of the histogram. O The distribution is skewed to the right. O The distribution is symmetric. O The distribution is skewed to the left. Percent 091 Percent Percent 140
The table shows the annual compensation of 40 randomly chosen CEOS (millions of dollars). 5.54 192.84 84.66 25.86 33.46 25.31 1.88 17.40 15.42 12.03 13.03 7.31 13.90 10.15 5.82 25.19 25.79 2.61 2.66 1.22 0.93 1.29 3.95 7.45 6.23 4.61 6.44 15.58 4.79 3.71 4.56 9.10 4.33 20.28 20.74 8.15 8.94 4.33 4.79 2.06 2 Click here for the Excel Data File (a) Select the correct histogram for the above data, Histogram A Histogram B Histogram 40 Histogram C Histogram 35 40 1 30 35 Histogram 40 25 30 35 20 25 30 15 20 25 10 15 20 10 10 100 120 180 Compensation 120 140 160 Compensation 120 160 O Histogram A 180 O Histogram B O Histogram C Compensation (b) Describe the shape of the histogram. O The distribution is skewed to the right. O The distribution is symmetric. O The distribution is skewed to the left. Percent 091 Percent Percent 140

Algebra & Trigonometry with Analytic Geometry
13th Edition
ISBN:9781133382119
Author:Swokowski
Publisher:Swokowski
Chapter10: Sequences, Series, And Probability
Section: Chapter Questions
Problem 29T

Related questions
Topic Video
Question
Transcribed Image Text:The table shows the annual compensation of 40 randomly chosen CEOS (millions of dollars).
5.54
1.88
17.40
15.42
12.03
13.03
25.31
25.19
25.79
20.28
20.74
7.31
7.45
6.23
4.61
6.44
13.90
10.15
9.10
8.15
8.94
5.82
192.84
84.66
25.86
33.46
2.61
2.66
1.22
3.95
15.58
4.79
3.71
4.56
4.33
4.33
4.79
2.06
0.93
1.29
Click here for the Excel Data File
(a) Select the correct histogram for the above data.
Histogram A
Histogram B
Histogram C
Histogram
40
Histogram
35
40
Histogram
30
35
40
25
30
35
20
25
30
15
20
25
10
15
20
10
15
10
5
180
Compensation
120
180
120
140
160
180
Compensation
Compensation
O Histogram A
O Histogram B
O Histogram C
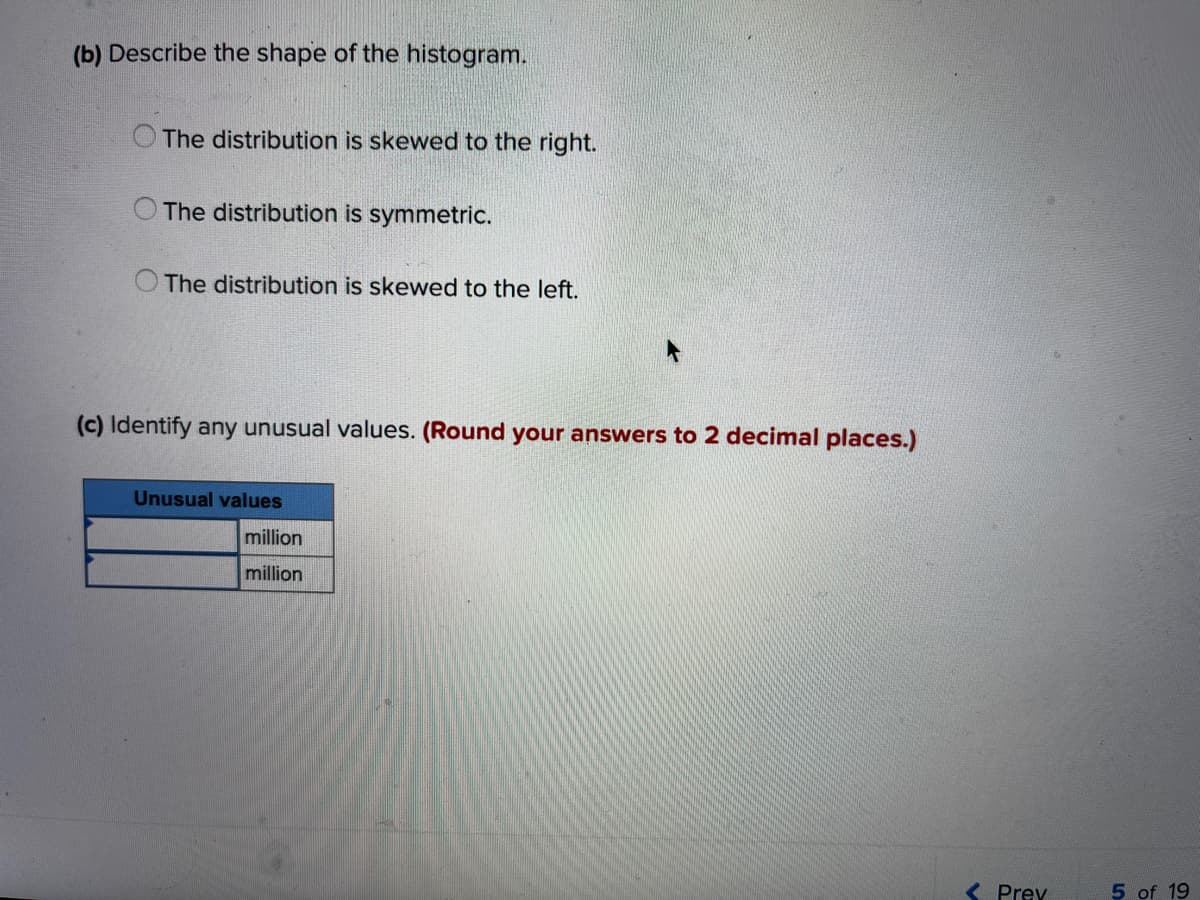
(b) Describe the shape of the histogram.
O The distribution is skewed to the right.
O The distribution is symmetric.
O The distribution is skewed to the left.
( Prev
5 of 19
Next >
Percent
Percent
140
091
Percent
Transcribed Image Text:(b) Describe the shape of the histogram.
The distribution is skewed to the right.
The distribution is symmetric.
The distribution is skewed to the left.
(c) Identify any unusual values. (Round your answers to 2 decimal places.)
Unusual values
million
million
Prey
5 of 19
Expert Solution
This question has been solved!
Explore an expertly crafted, step-by-step solution for a thorough understanding of key concepts.

This is a popular solution!

Trending now
This is a popular solution!

Step by step
Solved in 2 steps with 4 images

Knowledge Booster


Learn more about
Need a deep-dive on the concept behind this application? Look no further. Learn more about this topic, statistics and related others by exploring similar questions and additional content below.Recommended textbooks for you
Algebra & Trigonometry with Analytic Geometry
Algebra
ISBN:
9781133382119
Author:
Swokowski
Publisher:
Cengage
Algebra & Trigonometry with Analytic Geometry
Algebra
ISBN:
9781133382119
Author:
Swokowski
Publisher:
Cengage