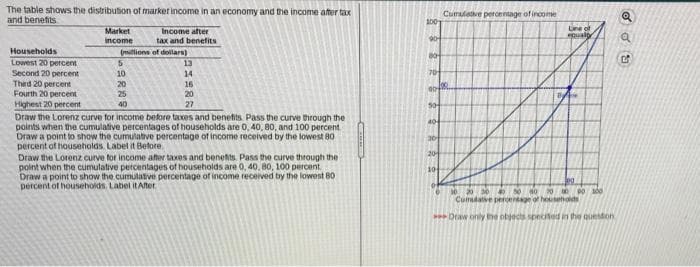
The table shows the distribution of market income in an economy and the income after tax and benefits Households Lowest 20 percent Second 20 percent Thad 20 percent Fourth 20 percent Highest 20 percent Market income millions of dollars) 5 10 20 25 Income after tax and benefits 40 13 14 16 20 27 Draw the Lorenz curve for income before taxes and benefits. Pass the curve through the points when the cumulative percentages of households are 0,40, 80, and 100 percent. Draw a point to show the cumulative percentage of income received by the lowest 80 percent of households Label it Before. Draw the Lorenz curve for income after taxes and benefits. Pass the curve through the point when the cumulative percentages of households are 0, 40, 80, 100 percent Draw a point to show the cumulative percentage of income received by the lowest 80 percent of households Label it After 2001 904 BO 704 00- 504 404 30 Cumulative percentage of income equally 30 30 30 40 50 60 70000 100 Cumdave percentage of households Draw only the objects specited in the question ROO
The table shows the distribution of market income in an economy and the income after tax and benefits Households Lowest 20 percent Second 20 percent Thad 20 percent Fourth 20 percent Highest 20 percent Market income millions of dollars) 5 10 20 25 Income after tax and benefits 40 13 14 16 20 27 Draw the Lorenz curve for income before taxes and benefits. Pass the curve through the points when the cumulative percentages of households are 0,40, 80, and 100 percent. Draw a point to show the cumulative percentage of income received by the lowest 80 percent of households Label it Before. Draw the Lorenz curve for income after taxes and benefits. Pass the curve through the point when the cumulative percentages of households are 0, 40, 80, 100 percent Draw a point to show the cumulative percentage of income received by the lowest 80 percent of households Label it After 2001 904 BO 704 00- 504 404 30 Cumulative percentage of income equally 30 30 30 40 50 60 70000 100 Cumdave percentage of households Draw only the objects specited in the question ROO

Microeconomics: Principles & Policy
14th Edition
ISBN:9781337794992
Author:William J. Baumol, Alan S. Blinder, John L. Solow
Publisher:William J. Baumol, Alan S. Blinder, John L. Solow
Chapter20: Poverty, Inequality, And Discrimination
Section: Chapter Questions
Problem 5DQ

Related questions
Question
I dont understand how to calculate and graph the second curve for income after taxes and benefits.
Note:-
- Do not provide handwritten solution. Maintain accuracy and quality in your answer. Take care of plagiarism.
- Answer completely.
- You will get up vote for sure.
Transcribed Image Text:The table shows the distribution of market income in an economy and the income after tax
and benefits
Households
Lowest 20 percent
Second 20 percent
Third 20 percent
Fourth 20 percent
Highest 20 percent
Market
income
Income after
tax and benefits
(millions of dollars)
5
10
20
25
40
13
14
16
20
27
Draw the Lorenz curve for income before taxes and benefits. Pass the curve through the
points when the cumulative percentages of households are 0, 40, 80, and 100 percent.
Draw a point to show the cumulative percentage of income received by the lowest 80
percent of households. Label it Before.
Draw the Lorenz curve for income after taxes and benefits. Pass the curve through the
point when the cumulative percentages of households are 0, 40, 80, 100 percent
Draw a point to show the cumulative percentage of income received by the lowest 80
percent of households. Label it After
200
904
80+
70
00-
50
404
30
204
104
Cumulative percentage of income
Line of
equally
630 20 30 40 50 60 20 000 200
Cumadative percentage of households
Draw only the objects specited in the question
SSE
C
Expert Solution
This question has been solved!
Explore an expertly crafted, step-by-step solution for a thorough understanding of key concepts.

This is a popular solution!

Trending now
This is a popular solution!

Step by step
Solved in 3 steps with 2 images

Knowledge Booster


Learn more about
Need a deep-dive on the concept behind this application? Look no further. Learn more about this topic, economics and related others by exploring similar questions and additional content below.Recommended textbooks for you
Microeconomics: Principles & Policy
Economics
ISBN:
9781337794992
Author:
William J. Baumol, Alan S. Blinder, John L. Solow
Publisher:
Cengage Learning

Principles of Economics 2e
Economics
ISBN:
9781947172364
Author:
Steven A. Greenlaw; David Shapiro
Publisher:
OpenStax

Principles of Microeconomics (MindTap Course List)
Economics
ISBN:
9781305971493
Author:
N. Gregory Mankiw
Publisher:
Cengage Learning
Microeconomics: Principles & Policy
Economics
ISBN:
9781337794992
Author:
William J. Baumol, Alan S. Blinder, John L. Solow
Publisher:
Cengage Learning
Principles of Economics 2e
Economics
ISBN:
9781947172364
Author:
Steven A. Greenlaw; David Shapiro
Publisher:
OpenStax
Principles of Microeconomics (MindTap Course List)
Economics
ISBN:
9781305971493
Author:
N. Gregory Mankiw
Publisher:
Cengage Learning

Principles of Economics (MindTap Course List)
Economics
ISBN:
9781305585126
Author:
N. Gregory Mankiw
Publisher:
Cengage Learning

Principles of Economics, 7th Edition (MindTap Cou…
Economics
ISBN:
9781285165875
Author:
N. Gregory Mankiw
Publisher:
Cengage Learning

Principles of Microeconomics
Economics
ISBN:
9781305156050
Author:
N. Gregory Mankiw
Publisher:
Cengage Learning