The table shows the total revenue (TR) and total costs (TC) of a perfect competitive company. Output (Q), units Total revenue (TR), $ Total costs (TC), $ Marginal revenue (MR), $ Marginal cos 80 1 24 100 24 20 12 2 48 112 24 120 3 4 24 24 72 8 96 126 5 120 131 24 24 5 144 138 7 7 168 192 147 24 24 8 158 11 216 240 264 173 191 213 240 271 24 24 24 24 24 15 18 22 27 31 10 11 12 13 Based on this data: 1. To build the curves of total revenue (TR) and total costs (TC) of the company. 2. To calculate, to fill in the table and to build the curves of marginal revenue (MR) and marginal cost (MC) of the company. 3. To determine graphically the output of the company providing the maximum profit. 288 312
The table shows the total revenue (TR) and total costs (TC) of a perfect competitive company. Output (Q), units Total revenue (TR), $ Total costs (TC), $ Marginal revenue (MR), $ Marginal cos 80 1 24 100 24 20 12 2 48 112 24 120 3 4 24 24 72 8 96 126 5 120 131 24 24 5 144 138 7 7 168 192 147 24 24 8 158 11 216 240 264 173 191 213 240 271 24 24 24 24 24 15 18 22 27 31 10 11 12 13 Based on this data: 1. To build the curves of total revenue (TR) and total costs (TC) of the company. 2. To calculate, to fill in the table and to build the curves of marginal revenue (MR) and marginal cost (MC) of the company. 3. To determine graphically the output of the company providing the maximum profit. 288 312

Chapter8: Perfect Competition
Section: Chapter Questions
Problem 2.4P

Related questions
Question
100%
1. To build the
2. To calculate, to fill in the table and to build the curves of marginal revenue (MR) and marginal cost (MC) of the company.
3. To determine graphically the output of the company providing the maximum profit.
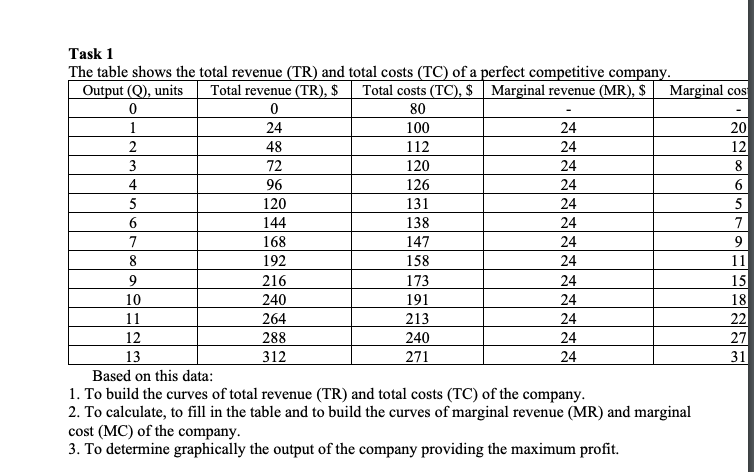
Transcribed Image Text:Task 1
The table shows the total revenue (TR) and total costs (TC) of a perfect competitive company.
Output (Q), units
Total revenue (TR), $
Total costs (TC), $ Marginal revenue (MR), $
Marginal cos
80
1
24
100
24
20
48
112
24
12
3
72
120
24
8
4
96
126
24
5
120
131
24
5
144
138
24
7
7
168
147
24
8
192
158
24
11
9
216
173
24
15
10
11
240
191
24
18
22
27
264
213
240
24
24
12
288
13
312
271
24
31
Based on this data:
1. To build the curves of total revenue (TR) and total costs (TC) of the company.
2. To calculate, to fill in the table and to build the curves of marginal revenue (MR) and marginal
cost (MC) of the company.
3. To determine graphically the output of the company providing the maximum profit.
Expert Solution
This question has been solved!
Explore an expertly crafted, step-by-step solution for a thorough understanding of key concepts.

This is a popular solution!

Trending now
This is a popular solution!

Step by step
Solved in 4 steps with 3 images

Knowledge Booster


Learn more about
Need a deep-dive on the concept behind this application? Look no further. Learn more about this topic, economics and related others by exploring similar questions and additional content below.Recommended textbooks for you


Principles of Economics 2e
Economics
ISBN:
9781947172364
Author:
Steven A. Greenlaw; David Shapiro
Publisher:
OpenStax
Principles of Economics 2e
Economics
ISBN:
9781947172364
Author:
Steven A. Greenlaw; David Shapiro
Publisher:
OpenStax

Principles of Economics, 7th Edition (MindTap Cou…
Economics
ISBN:
9781285165875
Author:
N. Gregory Mankiw
Publisher:
Cengage Learning

Essentials of Economics (MindTap Course List)
Economics
ISBN:
9781337091992
Author:
N. Gregory Mankiw
Publisher:
Cengage Learning

Principles of Microeconomics (MindTap Course List)
Economics
ISBN:
9781305971493
Author:
N. Gregory Mankiw
Publisher:
Cengage Learning