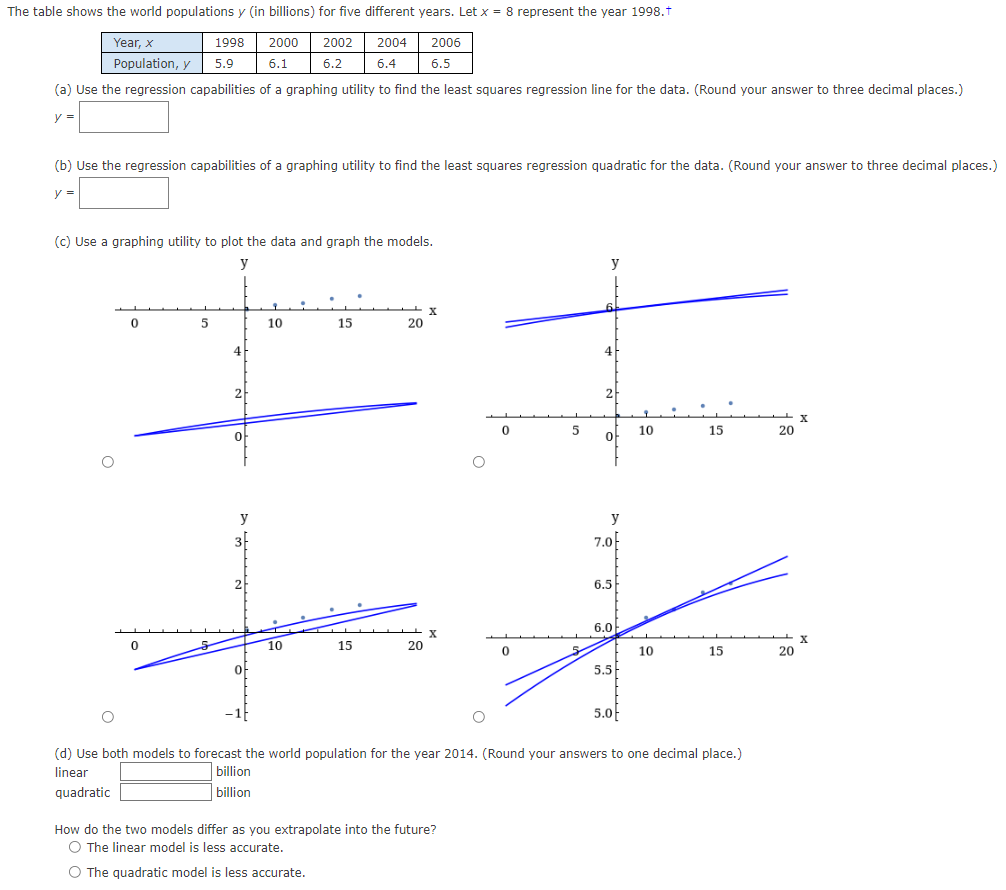
The table shows the world populations y (in billions) for five different years. Let x = 8 represent the year 1998.† 1998 Year, x Population, y 5.9 2000 2002 2004 2006 6.1 6.2 6.4 6.5 (a) Use the regression capabilities of a graphing utility to find the least squares regression line for the data. (Round your answer to three decimal places.) y = (b) Use the regression capabilities of a graphing utility to find the least squares regression quadratic for the data. (Round your answer to three decimal places.) y = (c) Use a graphing utility to plot the data and graph the models. 0 5 2 O 10 15 + 0 10 o 15 20 20 X 0 0 아 y 7.0 6.5 6.0 5.5 5.0 10 10 15 15 20 20 X X
The table shows the world populations y (in billions) for five different years. Let x = 8 represent the year 1998.† 1998 Year, x Population, y 5.9 2000 2002 2004 2006 6.1 6.2 6.4 6.5 (a) Use the regression capabilities of a graphing utility to find the least squares regression line for the data. (Round your answer to three decimal places.) y = (b) Use the regression capabilities of a graphing utility to find the least squares regression quadratic for the data. (Round your answer to three decimal places.) y = (c) Use a graphing utility to plot the data and graph the models. 0 5 2 O 10 15 + 0 10 o 15 20 20 X 0 0 아 y 7.0 6.5 6.0 5.5 5.0 10 10 15 15 20 20 X X

Linear Algebra: A Modern Introduction
4th Edition
ISBN:9781285463247
Author:David Poole
Publisher:David Poole
Chapter7: Distance And Approximation
Section7.3: Least Squares Approximation
Problem 34EQ

Related questions
Question
1-8
Transcribed Image Text:The table shows the world populations y (in billions) for five different years. Let x = 8 represent the year 1998.†
Year, x
1998
2000 2002
6.1 6.2
2004
6.4
Population, y 5.9
(a) Use the regression capabilities of a graphing utility to find the least squares regression line for the data. (Round your answer to three decimal places.)
y =
(b) Use the regression capabilities of a graphing utility to find the least squares regression quadratic for the data. (Round your answer to three decimal places.)
y =
(c) Use a graphing utility to plot the data and graph the models.
y
0
5
0
4
2
0
10
2006
6.5
15
20
X
X
20
O
y
y
7.0
2
6.5
k f
6.0
10
15
0
10
15
0
5.5
5.0
y
4
+
2
5
0 of
10
15
How do the two models differ as you extrapolate into the future?
O The linear model is less accurate.
O The quadratic model is less accurate.
0
(d) Use both models to forecast the world population for the year 2014. (Round your answers to one decimal place.)
linear
billion
quadratic
billion
20
20
X
X
Expert Solution
This question has been solved!
Explore an expertly crafted, step-by-step solution for a thorough understanding of key concepts.

Step by step
Solved in 3 steps with 4 images

Recommended textbooks for you
Linear Algebra: A Modern Introduction
Algebra
ISBN:
9781285463247
Author:
David Poole
Publisher:
Cengage Learning

College Algebra
Algebra
ISBN:
9781305115545
Author:
James Stewart, Lothar Redlin, Saleem Watson
Publisher:
Cengage Learning

Algebra & Trigonometry with Analytic Geometry
Algebra
ISBN:
9781133382119
Author:
Swokowski
Publisher:
Cengage
Linear Algebra: A Modern Introduction
Algebra
ISBN:
9781285463247
Author:
David Poole
Publisher:
Cengage Learning
College Algebra
Algebra
ISBN:
9781305115545
Author:
James Stewart, Lothar Redlin, Saleem Watson
Publisher:
Cengage Learning
Algebra & Trigonometry with Analytic Geometry
Algebra
ISBN:
9781133382119
Author:
Swokowski
Publisher:
Cengage

Algebra and Trigonometry (MindTap Course List)
Algebra
ISBN:
9781305071742
Author:
James Stewart, Lothar Redlin, Saleem Watson
Publisher:
Cengage Learning

Trigonometry (MindTap Course List)
Trigonometry
ISBN:
9781305652224
Author:
Charles P. McKeague, Mark D. Turner
Publisher:
Cengage Learning