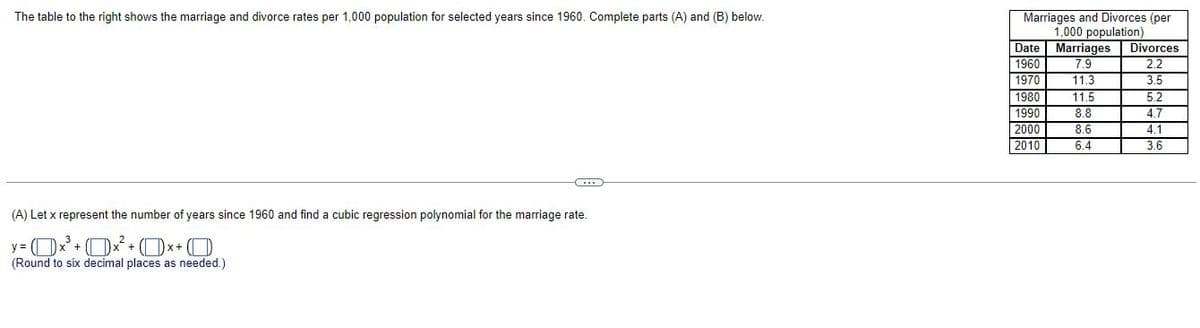
The table to the right shows the marriage and divorce rates per 1,000 population for selected years since 1960. Complete parts (A) and (B) below. T (A) Let x represent the number of years since 1960 and find a cubic regression polynomial for the marriage rate. y=0x³ + 0x² +0×+0. (Round to six decimal places as needed.) Marriages and Divorces (per 1,000 population) Date Marriages Divorces 1960 7.9 2.2 1970 11.3 11.3 3.5 1980 11.5 5.2 1990 8.8 4.7 2000 8.6 4.1 2010 6.4 3.6
The table to the right shows the marriage and divorce rates per 1,000 population for selected years since 1960. Complete parts (A) and (B) below. T (A) Let x represent the number of years since 1960 and find a cubic regression polynomial for the marriage rate. y=0x³ + 0x² +0×+0. (Round to six decimal places as needed.) Marriages and Divorces (per 1,000 population) Date Marriages Divorces 1960 7.9 2.2 1970 11.3 11.3 3.5 1980 11.5 5.2 1990 8.8 4.7 2000 8.6 4.1 2010 6.4 3.6

Chapter3: Polynomial Functions
Section: Chapter Questions
Problem 18T

Related questions
Question
21
Transcribed Image Text:The table to the right shows the marriage and divorce rates per 1,000 population for selected years since 1960. Complete parts (A) and (B) below.
C
(A) Let x represent the number of years since 1960 and find a cubic regression polynomial for the marriage rate.
y= (x³ + x² + (x+O
(Round to six decimal places as needed.)
Marriages and Divorces (per
1,000 population)
Date
Marriages Divorces
1960
7.9
2.2
1970
11.3
3.5
1980
11.5
5.2
1990
8.8
4.7
2000
8.6
4.1
2010
6.4
3.6
Expert Solution
This question has been solved!
Explore an expertly crafted, step-by-step solution for a thorough understanding of key concepts.

This is a popular solution!

Trending now
This is a popular solution!

Step by step
Solved in 2 steps with 2 images

Recommended textbooks for you

Algebra & Trigonometry with Analytic Geometry
Algebra
ISBN:
9781133382119
Author:
Swokowski
Publisher:
Cengage

College Algebra (MindTap Course List)
Algebra
ISBN:
9781305652231
Author:
R. David Gustafson, Jeff Hughes
Publisher:
Cengage Learning
Algebra & Trigonometry with Analytic Geometry
Algebra
ISBN:
9781133382119
Author:
Swokowski
Publisher:
Cengage
College Algebra (MindTap Course List)
Algebra
ISBN:
9781305652231
Author:
R. David Gustafson, Jeff Hughes
Publisher:
Cengage Learning

Algebra and Trigonometry (MindTap Course List)
Algebra
ISBN:
9781305071742
Author:
James Stewart, Lothar Redlin, Saleem Watson
Publisher:
Cengage Learning