The television show September Road has been successful for many years. That show recently had a share of 31, which means, that among the TV sets in use, 31% were tuned to September Road. An advertiser wants to verify that 31% share value by conducting its own survey, and a pilot survey begins with 10 households have TV sets in use at the time of a September Road broadcast. Find the probability that none of the households are tuned to September Road. P(none) = Find the probability that at least one household is tuned to September Road. P(at least one) = Find the probability that at most one household is tuned to September Road. P(at most one) = %3D If at most one household is tuned to September Road, does it appear that the 31% share value is wrong? (Hint: Is the occurrence of at most one household tuned to September Road unusual?) yes, it is wrong no, it is not wrong
The television show September Road has been successful for many years. That show recently had a share of 31, which means, that among the TV sets in use, 31% were tuned to September Road. An advertiser wants to verify that 31% share value by conducting its own survey, and a pilot survey begins with 10 households have TV sets in use at the time of a September Road broadcast. Find the probability that none of the households are tuned to September Road. P(none) = Find the probability that at least one household is tuned to September Road. P(at least one) = Find the probability that at most one household is tuned to September Road. P(at most one) = %3D If at most one household is tuned to September Road, does it appear that the 31% share value is wrong? (Hint: Is the occurrence of at most one household tuned to September Road unusual?) yes, it is wrong no, it is not wrong

Holt Mcdougal Larson Pre-algebra: Student Edition 2012
1st Edition
ISBN:9780547587776
Author:HOLT MCDOUGAL
Publisher:HOLT MCDOUGAL
Chapter11: Data Analysis And Probability
Section11.8: Probabilities Of Disjoint And Overlapping Events
Problem 2C

Related questions

Concept explainers
Contingency Table
A contingency table can be defined as the visual representation of the relationship between two or more categorical variables that can be evaluated and registered. It is a categorical version of the scatterplot, which is used to investigate the linear relationship between two variables. A contingency table is indeed a type of frequency distribution table that displays two variables at the same time.
Binomial Distribution
Binomial is an algebraic expression of the sum or the difference of two terms. Before knowing about binomial distribution, we must know about the binomial theorem.
Topic Video
Question
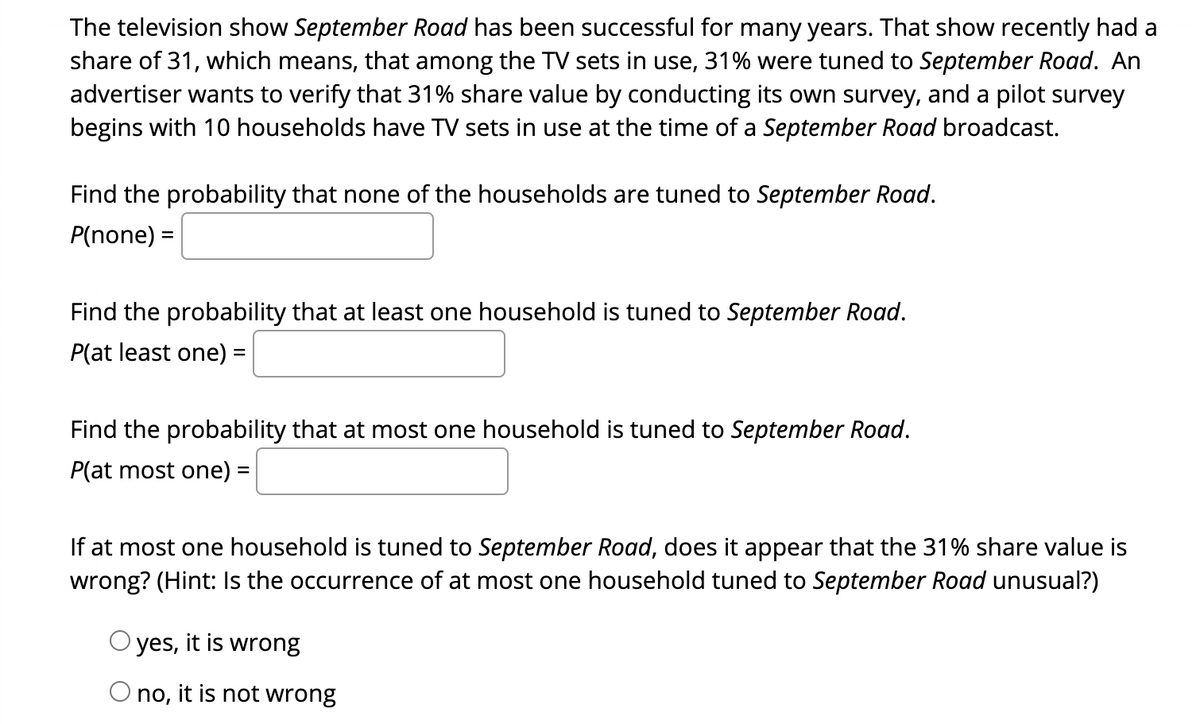
Transcribed Image Text:The television show September Road has been successful for many years. That show recently had a
share of 31, which means, that among the TV sets in use, 31% were tuned to September Road. An
advertiser wants to verify that 31% share value by conducting its own survey, and a pilot survey
begins with 10 households have TV sets in use at the time of a September Road broadcast.
Find the probability that none of the households are tuned to September Road.
P(none) =
Find the probability that at least one household is tuned to September Road.
P(at least one) =
Find the probability that at most one household is tuned to September Road.
P(at most one) =
%3D
If at most one household is tuned to September Road, does it appear that the 31% share value is
wrong? (Hint: Is the occurrence of at most one household tuned to September Road unusual?)
O yes, it is wrong
O no, it is not wrong
Expert Solution
This question has been solved!
Explore an expertly crafted, step-by-step solution for a thorough understanding of key concepts.

This is a popular solution!

Trending now
This is a popular solution!

Step by step
Solved in 2 steps with 2 images

Knowledge Booster


Learn more about
Need a deep-dive on the concept behind this application? Look no further. Learn more about this topic, statistics and related others by exploring similar questions and additional content below.Recommended textbooks for you
Holt Mcdougal Larson Pre-algebra: Student Edition…
Algebra
ISBN:
9780547587776
Author:
HOLT MCDOUGAL
Publisher:
HOLT MCDOUGAL

Holt Mcdougal Larson Pre-algebra: Student Edition…
Algebra
ISBN:
9780547587776
Author:
HOLT MCDOUGAL
Publisher:
HOLT MCDOUGAL